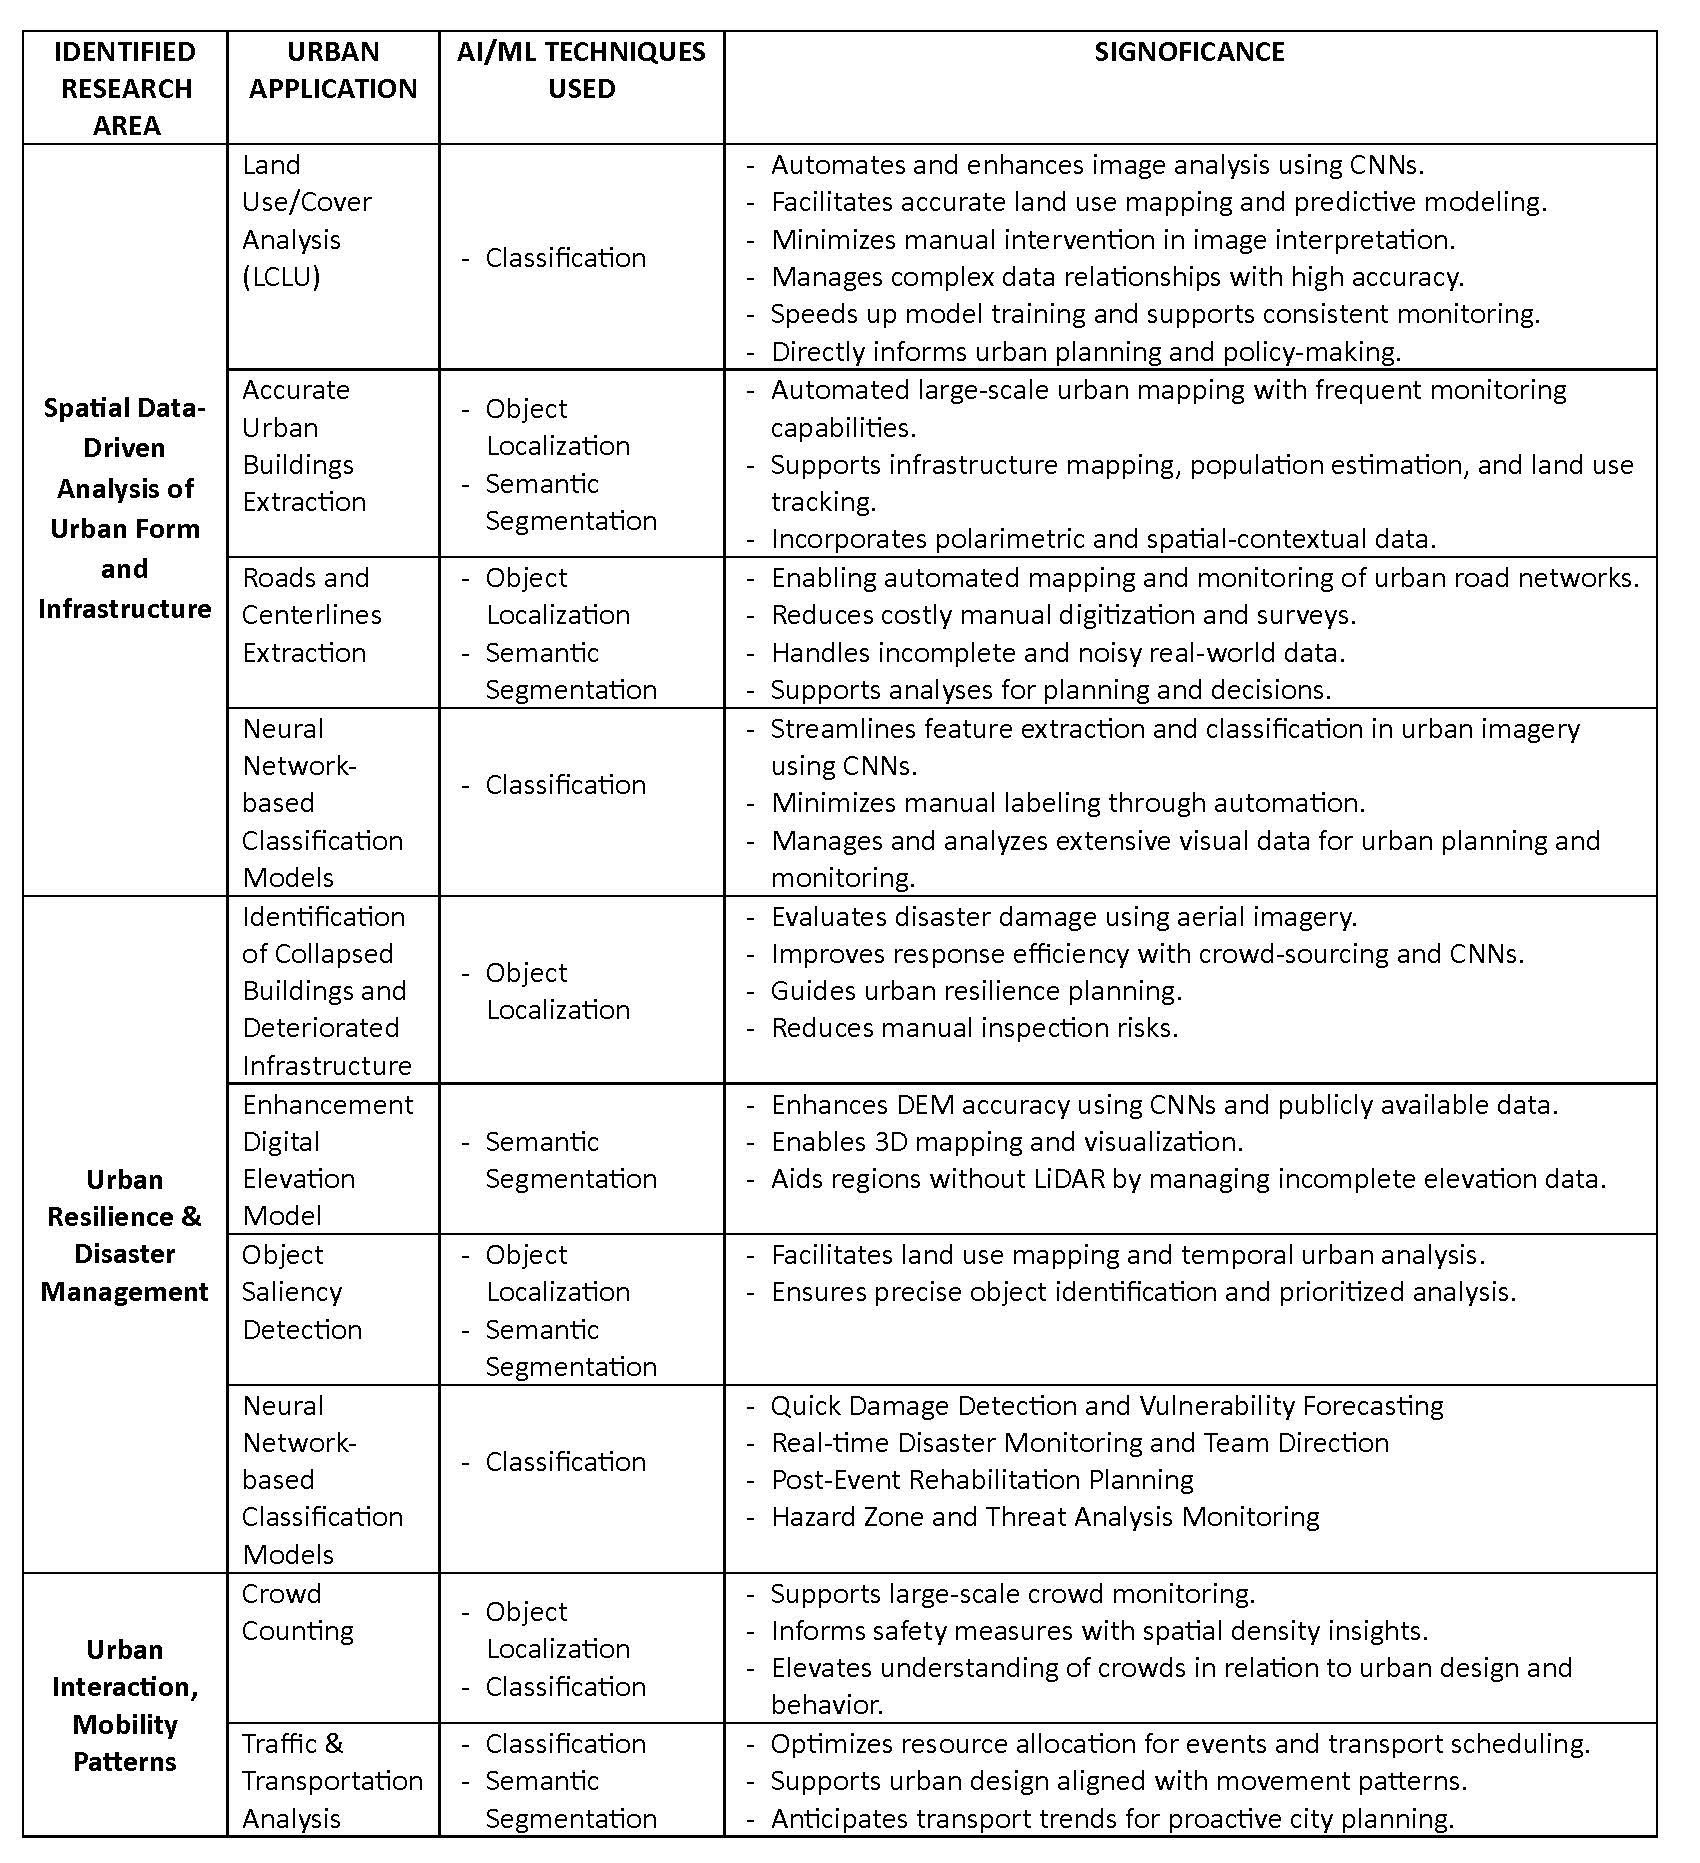
INTELLIGENT TRANSECT ANALYSIS
A Comparative Analysis of Traditional and Machine Learning Approaches
In collaboration with
Carla Brisotto, Jeff Carney, Forough Foroutan, and Whittaker Schroder
,
Aim of study
The goal of the authors’ experiment was to compare an analogical transect analysis method to an AI one to identify urban indicators of the residents' well-being.
Main research question
How can place-based research be scaled up by integrating ML approaches?
How can environmental, and physical features serving as well-being indicators be classified at the urban/water intersection?
Additional Questions:
What kind of contribution can the AI approach make to developing transect analysis methodologies?
If and how it can connect digitally generated site analysis to traditional knowledge (long-time knowledge of a specific community)
Case Studies:
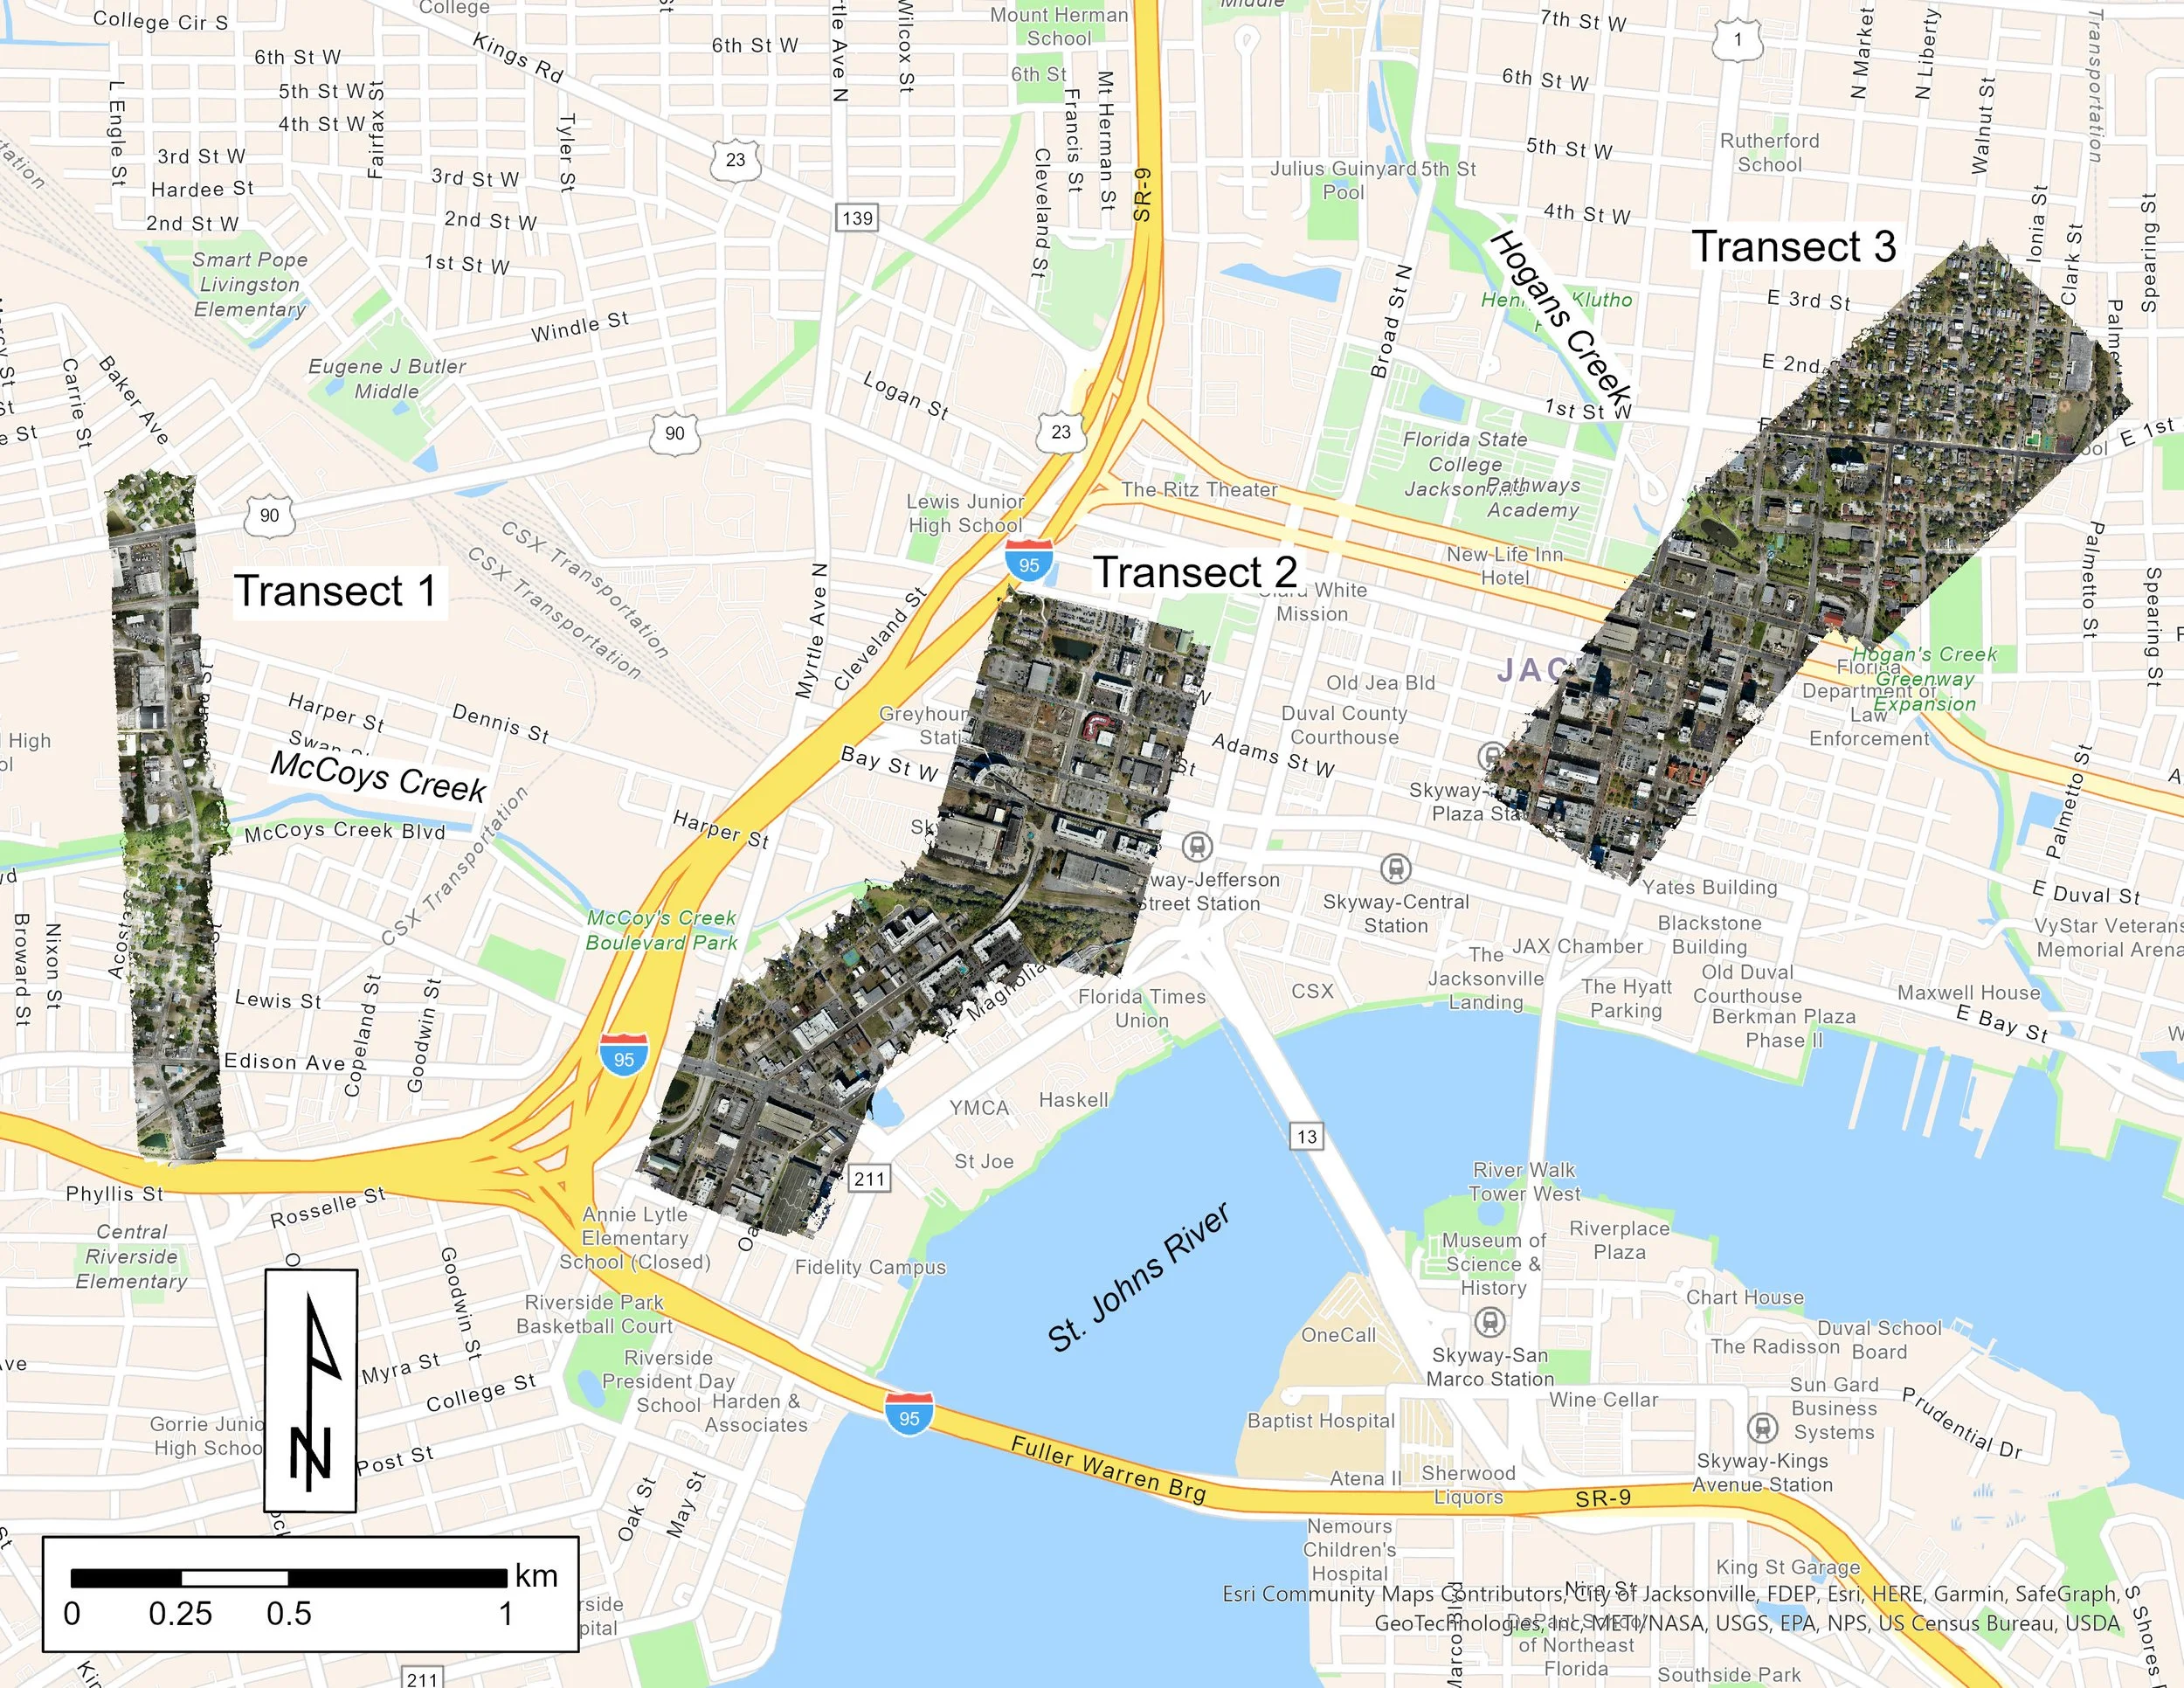
On three transects across two local watersheds in Jacksonville's McCoy and Hogan creeks areas
What is Transect Analysis?
Transect analysis is a method used in various disciplines, including ecology, geography, urban planning, and landscape architecture. The term "transect" refers to a line or path along which observations or measurements are made to understand the characteristics of a particular environment or area. The main goal of transect analysis is to provide a systematic way to study and document changes across a landscape or along a specific path.
The process of transect analysis typically involves selecting a linear path through the area of interest, making observations or measurements at regular intervals along the transect, and then analyzing the collected data to identify patterns and trends. Transect analysis provides a holistic view of a landscape, allowing researchers and professionals to capture the diversity and complexity of an environment by considering both visible and hidden elements.
Source: https://www.cnu.org/publicsquare/transect-diagram-diversity
Where did Transect Analysis come from?
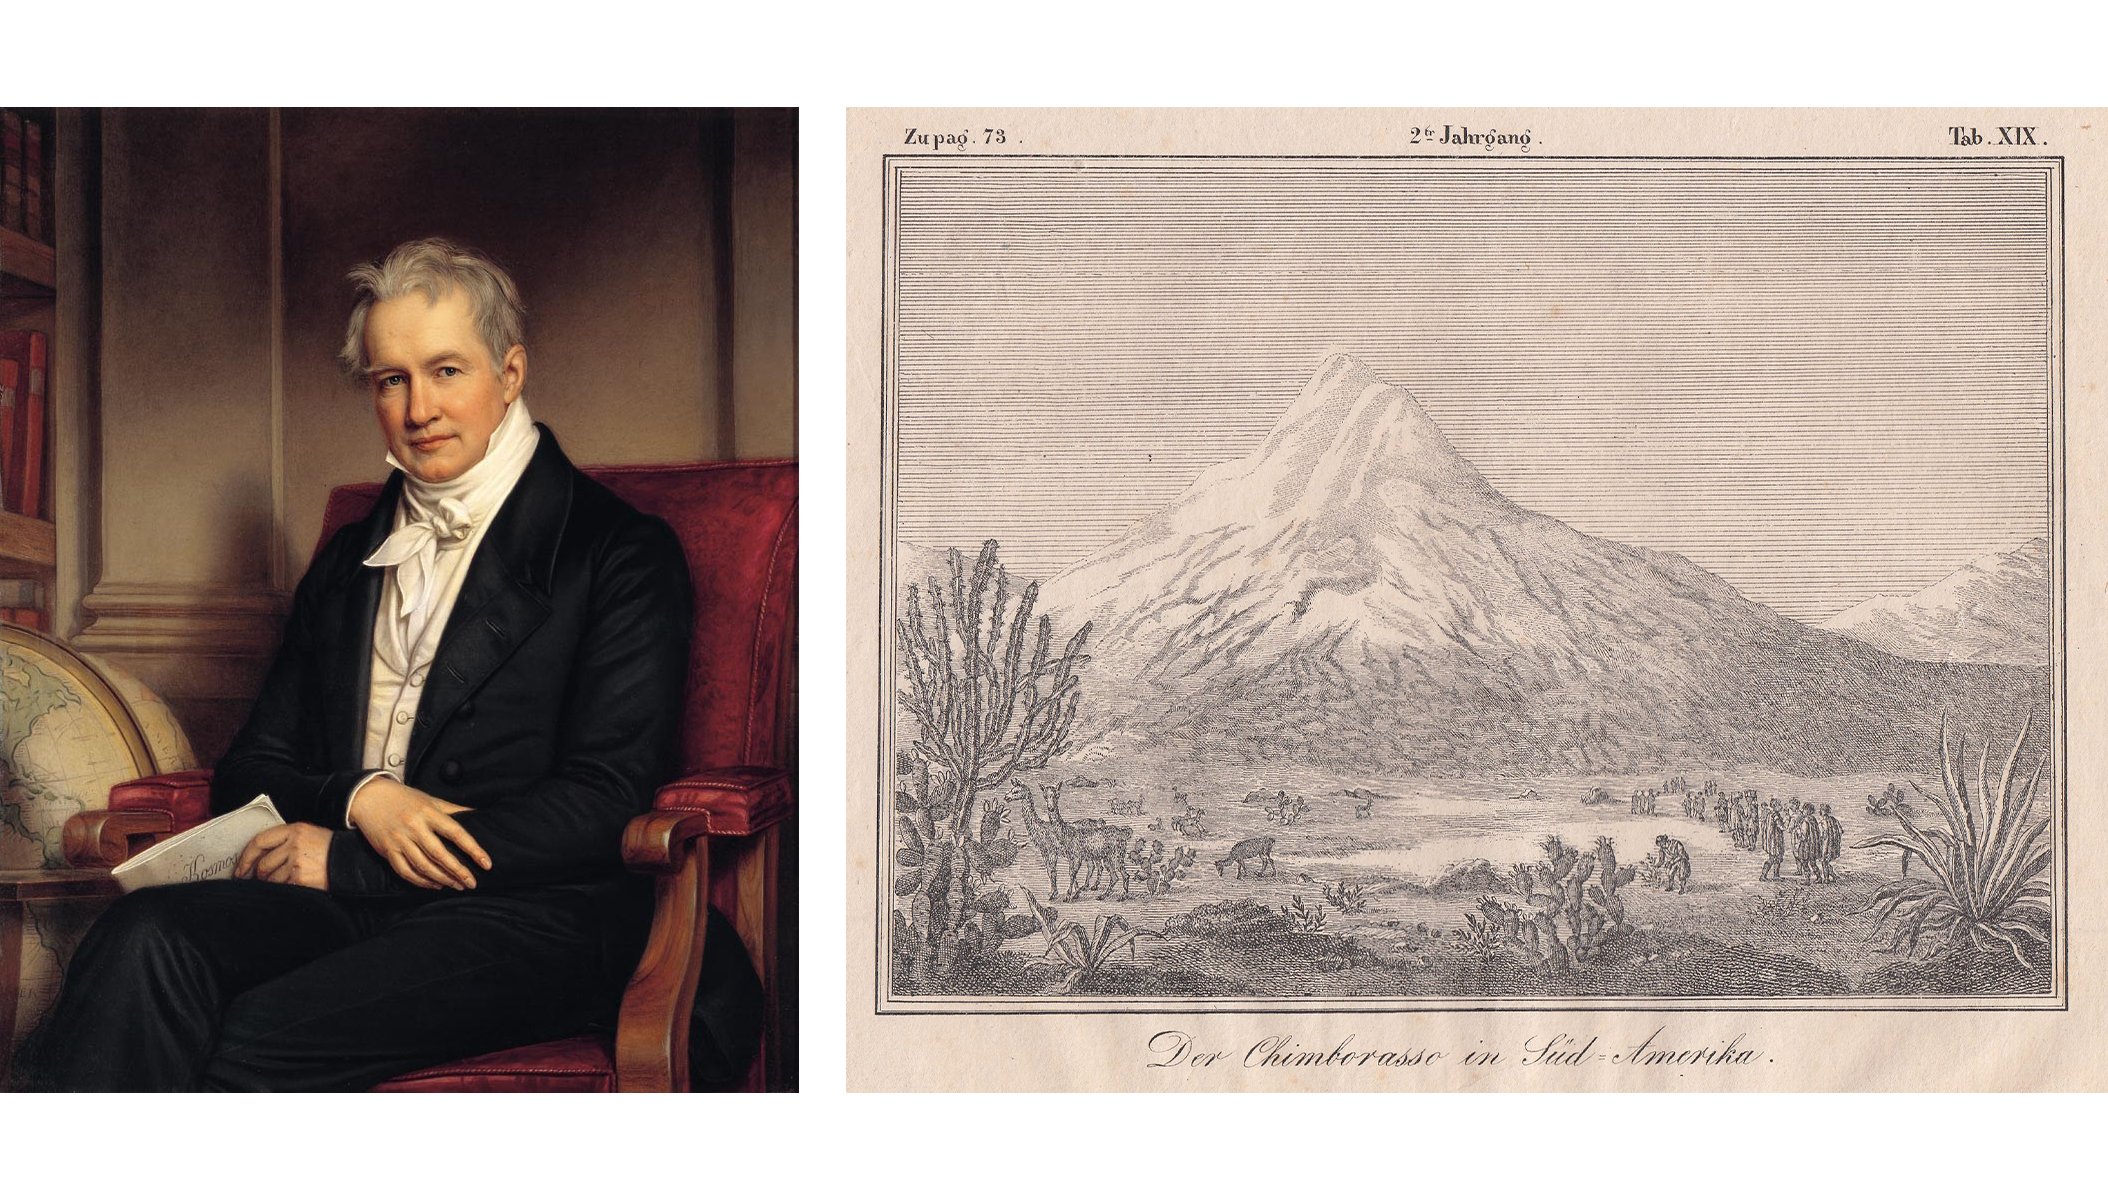
The first example comes from Alexander von Humboldt, a German geographer, who conducted ecosystem mapping starting in 1793. His famous drawing of the Volcano Chimborazo in 1829 describes all the geological layers across its section virtually connecting the sky to the center of the Earth.
Alexander von Humboldt and his drawing of the Volcano Chimborazo
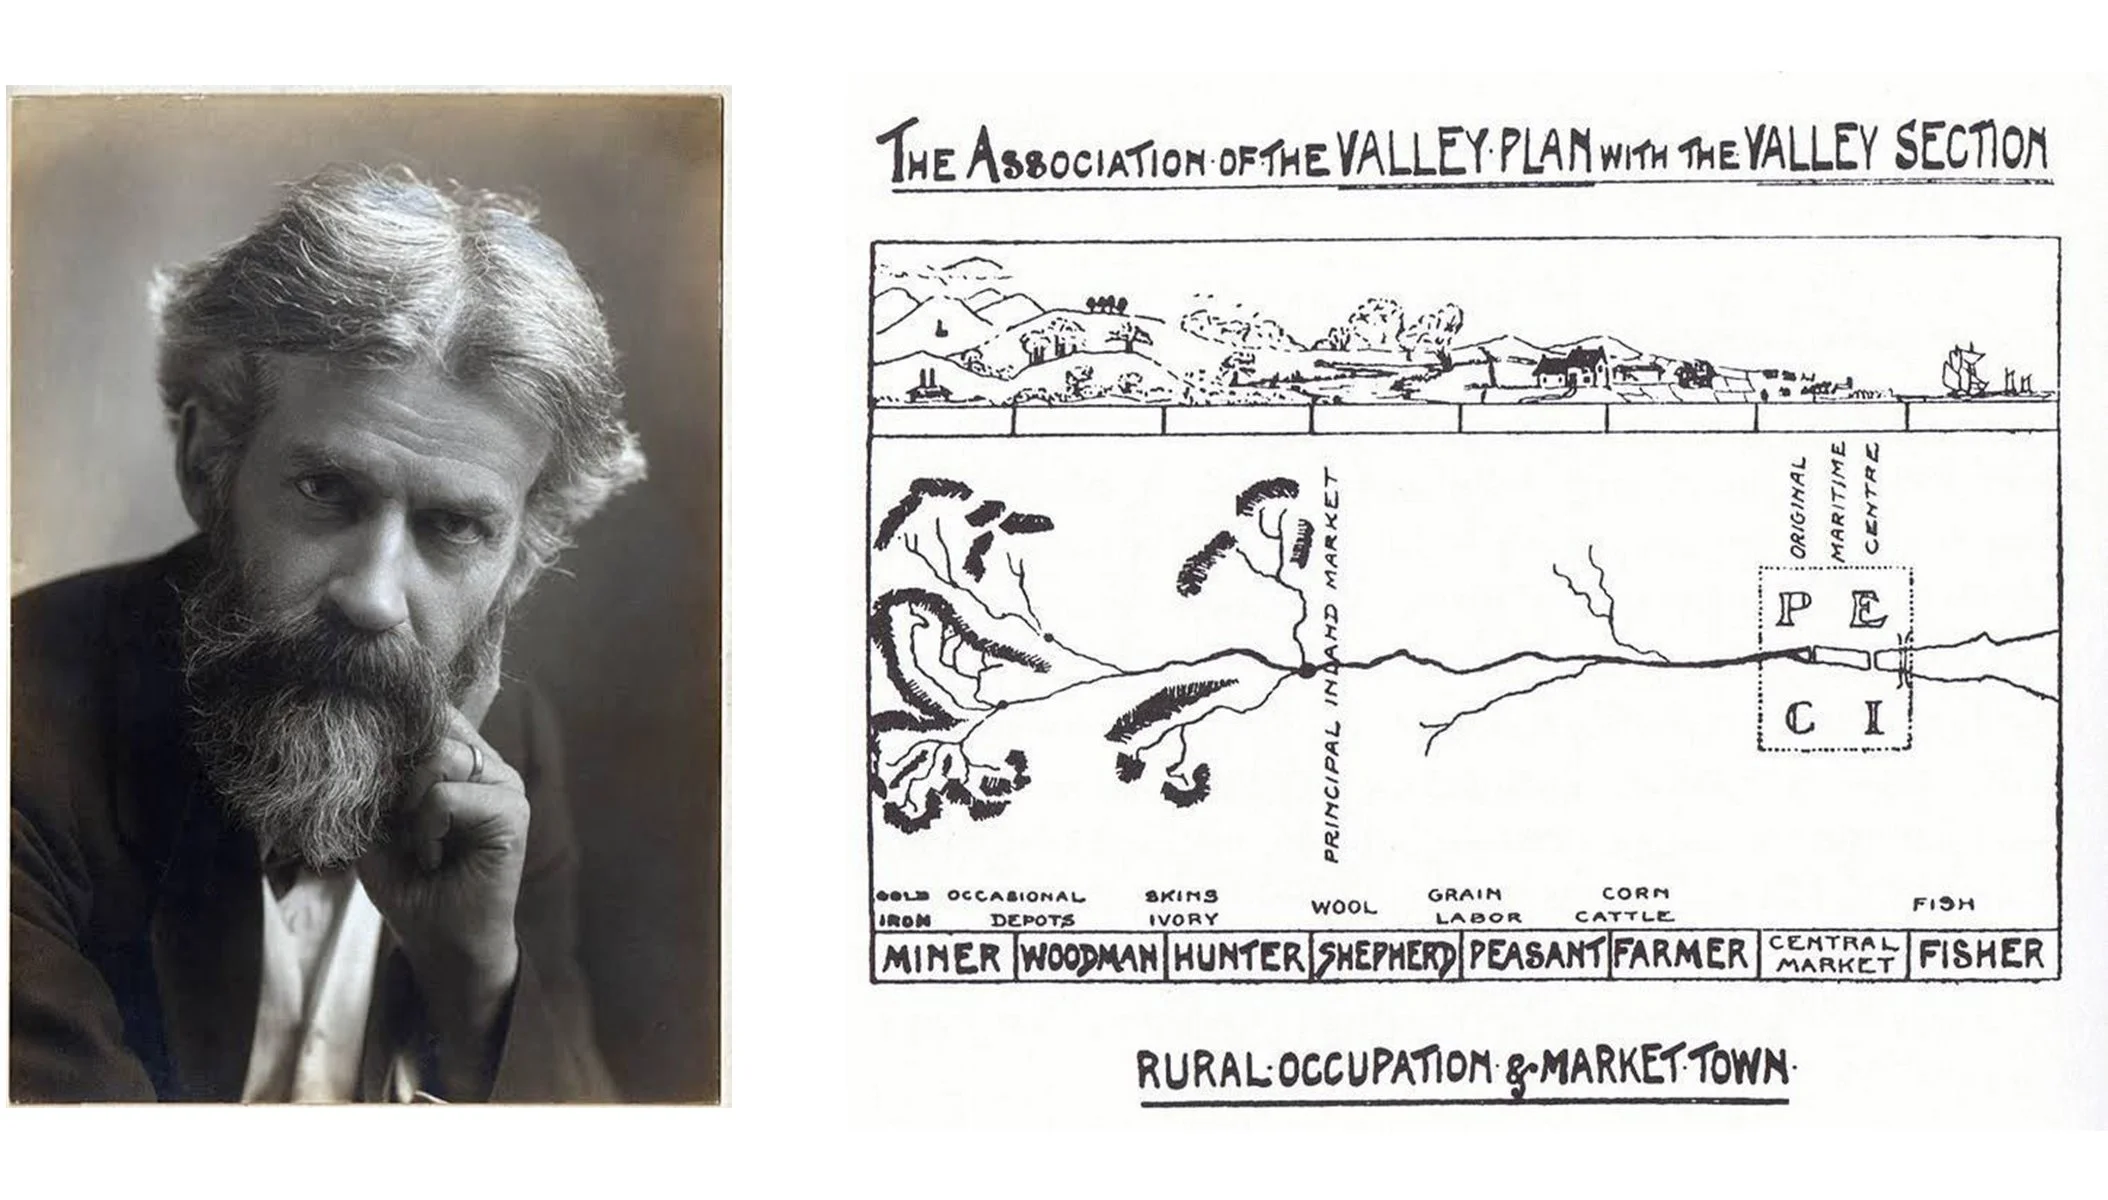
Patrick Geddes further developed this approach focusing on the holistic exploration of a location. His Valley Section introduced the human habitat within the landscape.
Patrick Geddes and his drawing of Valley Palm
Methodology
Analogic Transects (AT) Analysis
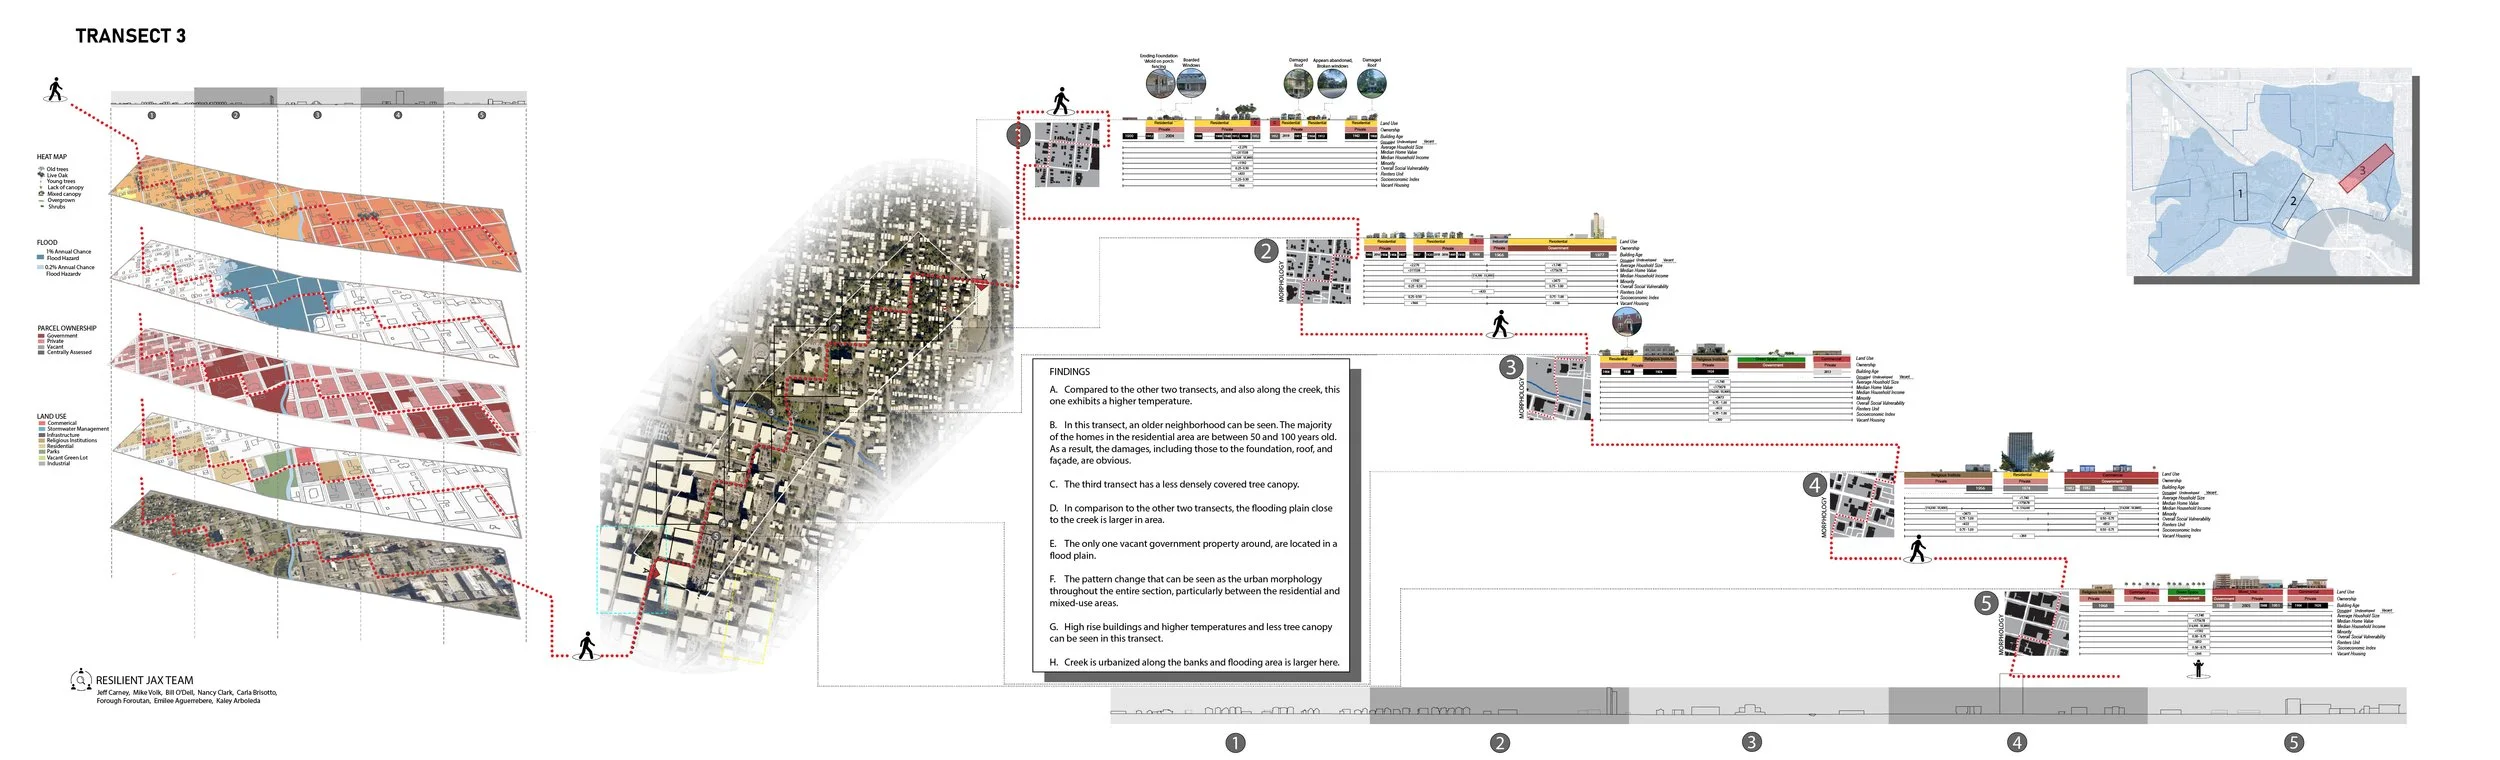
This method utilized participatory design and data analysis. The authors, in collaboration with local organizations, students, and residents of the area, conducted participatory walks along the three transects to explore how urban wellbeing indicators changed in terms of extent, timing, and manner from the vicinity of the creek to its periphery.
This exploration integrated geographic information systems (GIS) mapping and data analysis mainly from Census data recording, which included aspects such as property ownership, building age and types, outdoor temperatures, urban morphology, socio-demographic data, and land uses.
Analogic Transects (AT) Analysis in Jacksonville
The mapping itself was divided into five parts, consisting of a central area encompassing the creeks and their banks, along with two sections on each side (Figure 1).
To complement the analogic transect analysis, the authors documented the transects with aerial low-altitude drone imagery using a DJI Mavic 2 Pro. This exploration integrated geographic information systems (GIS) mapping and data analysis mainly from Census data recording, which included aspects such as property ownership, building age and types, outdoor temperatures, urban morphology, socio-demographic data, and land uses.
AI Transect analysis methodology
Machine Learning Transects (MLT)
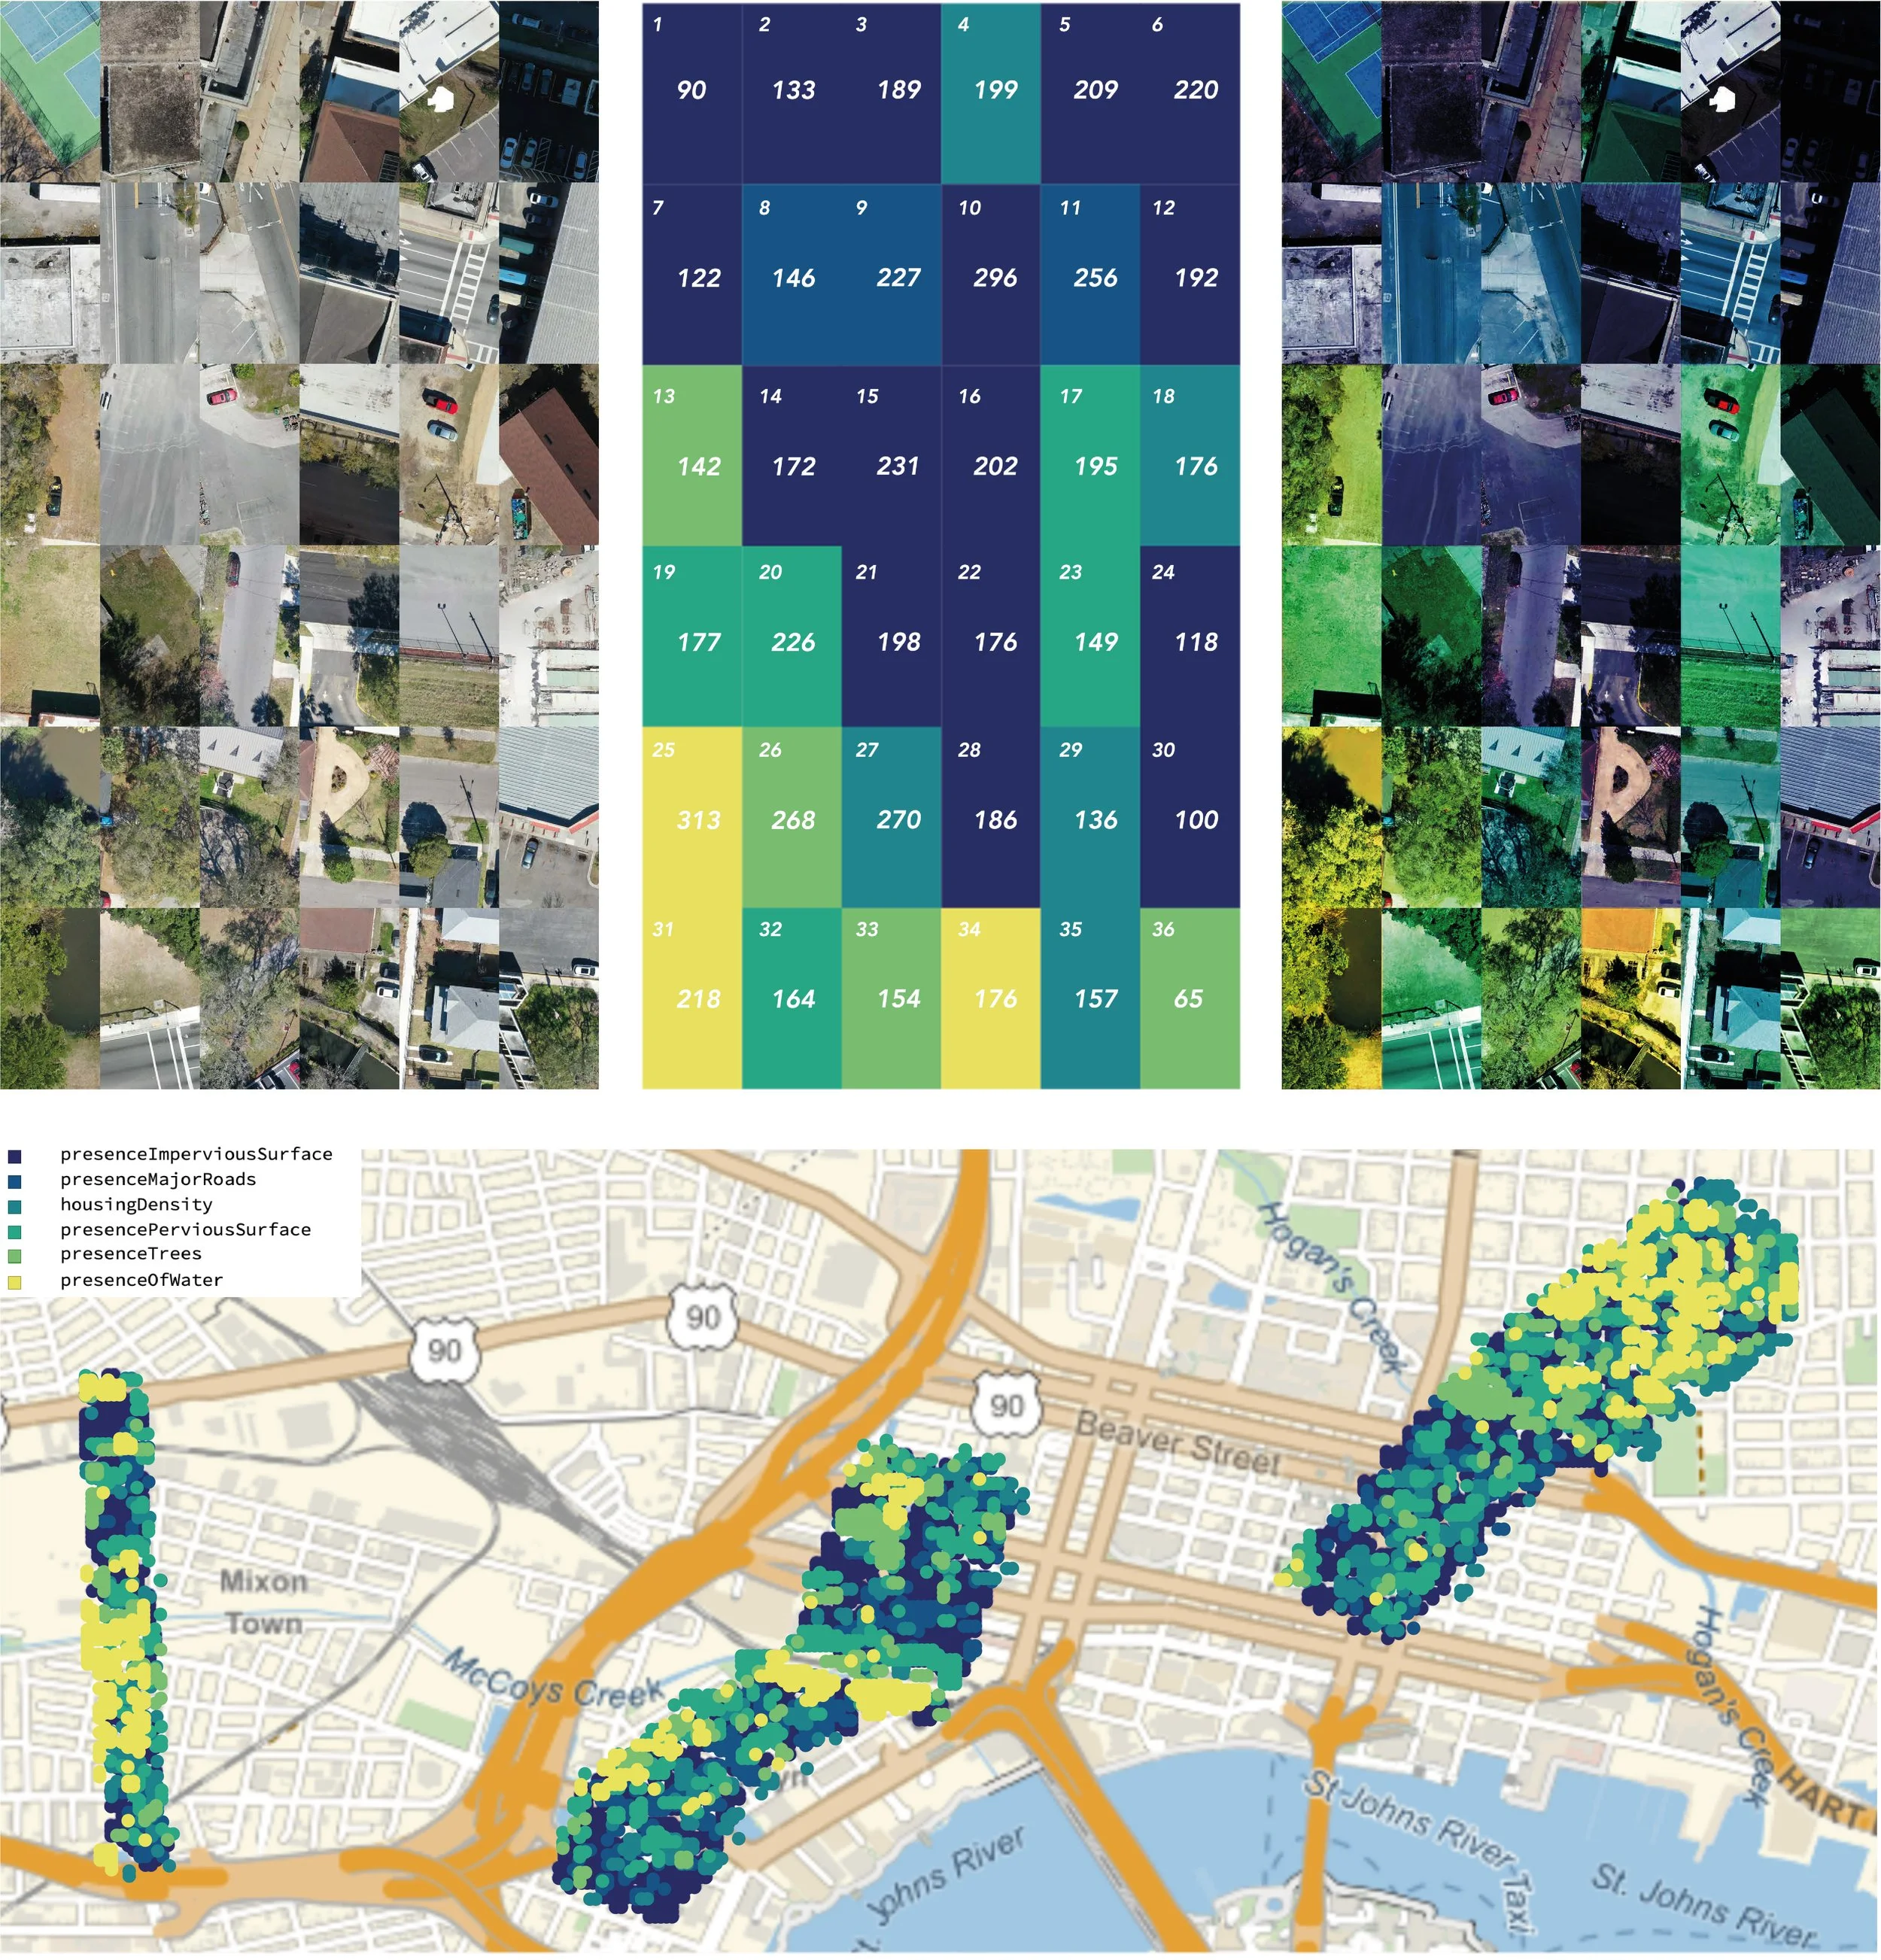
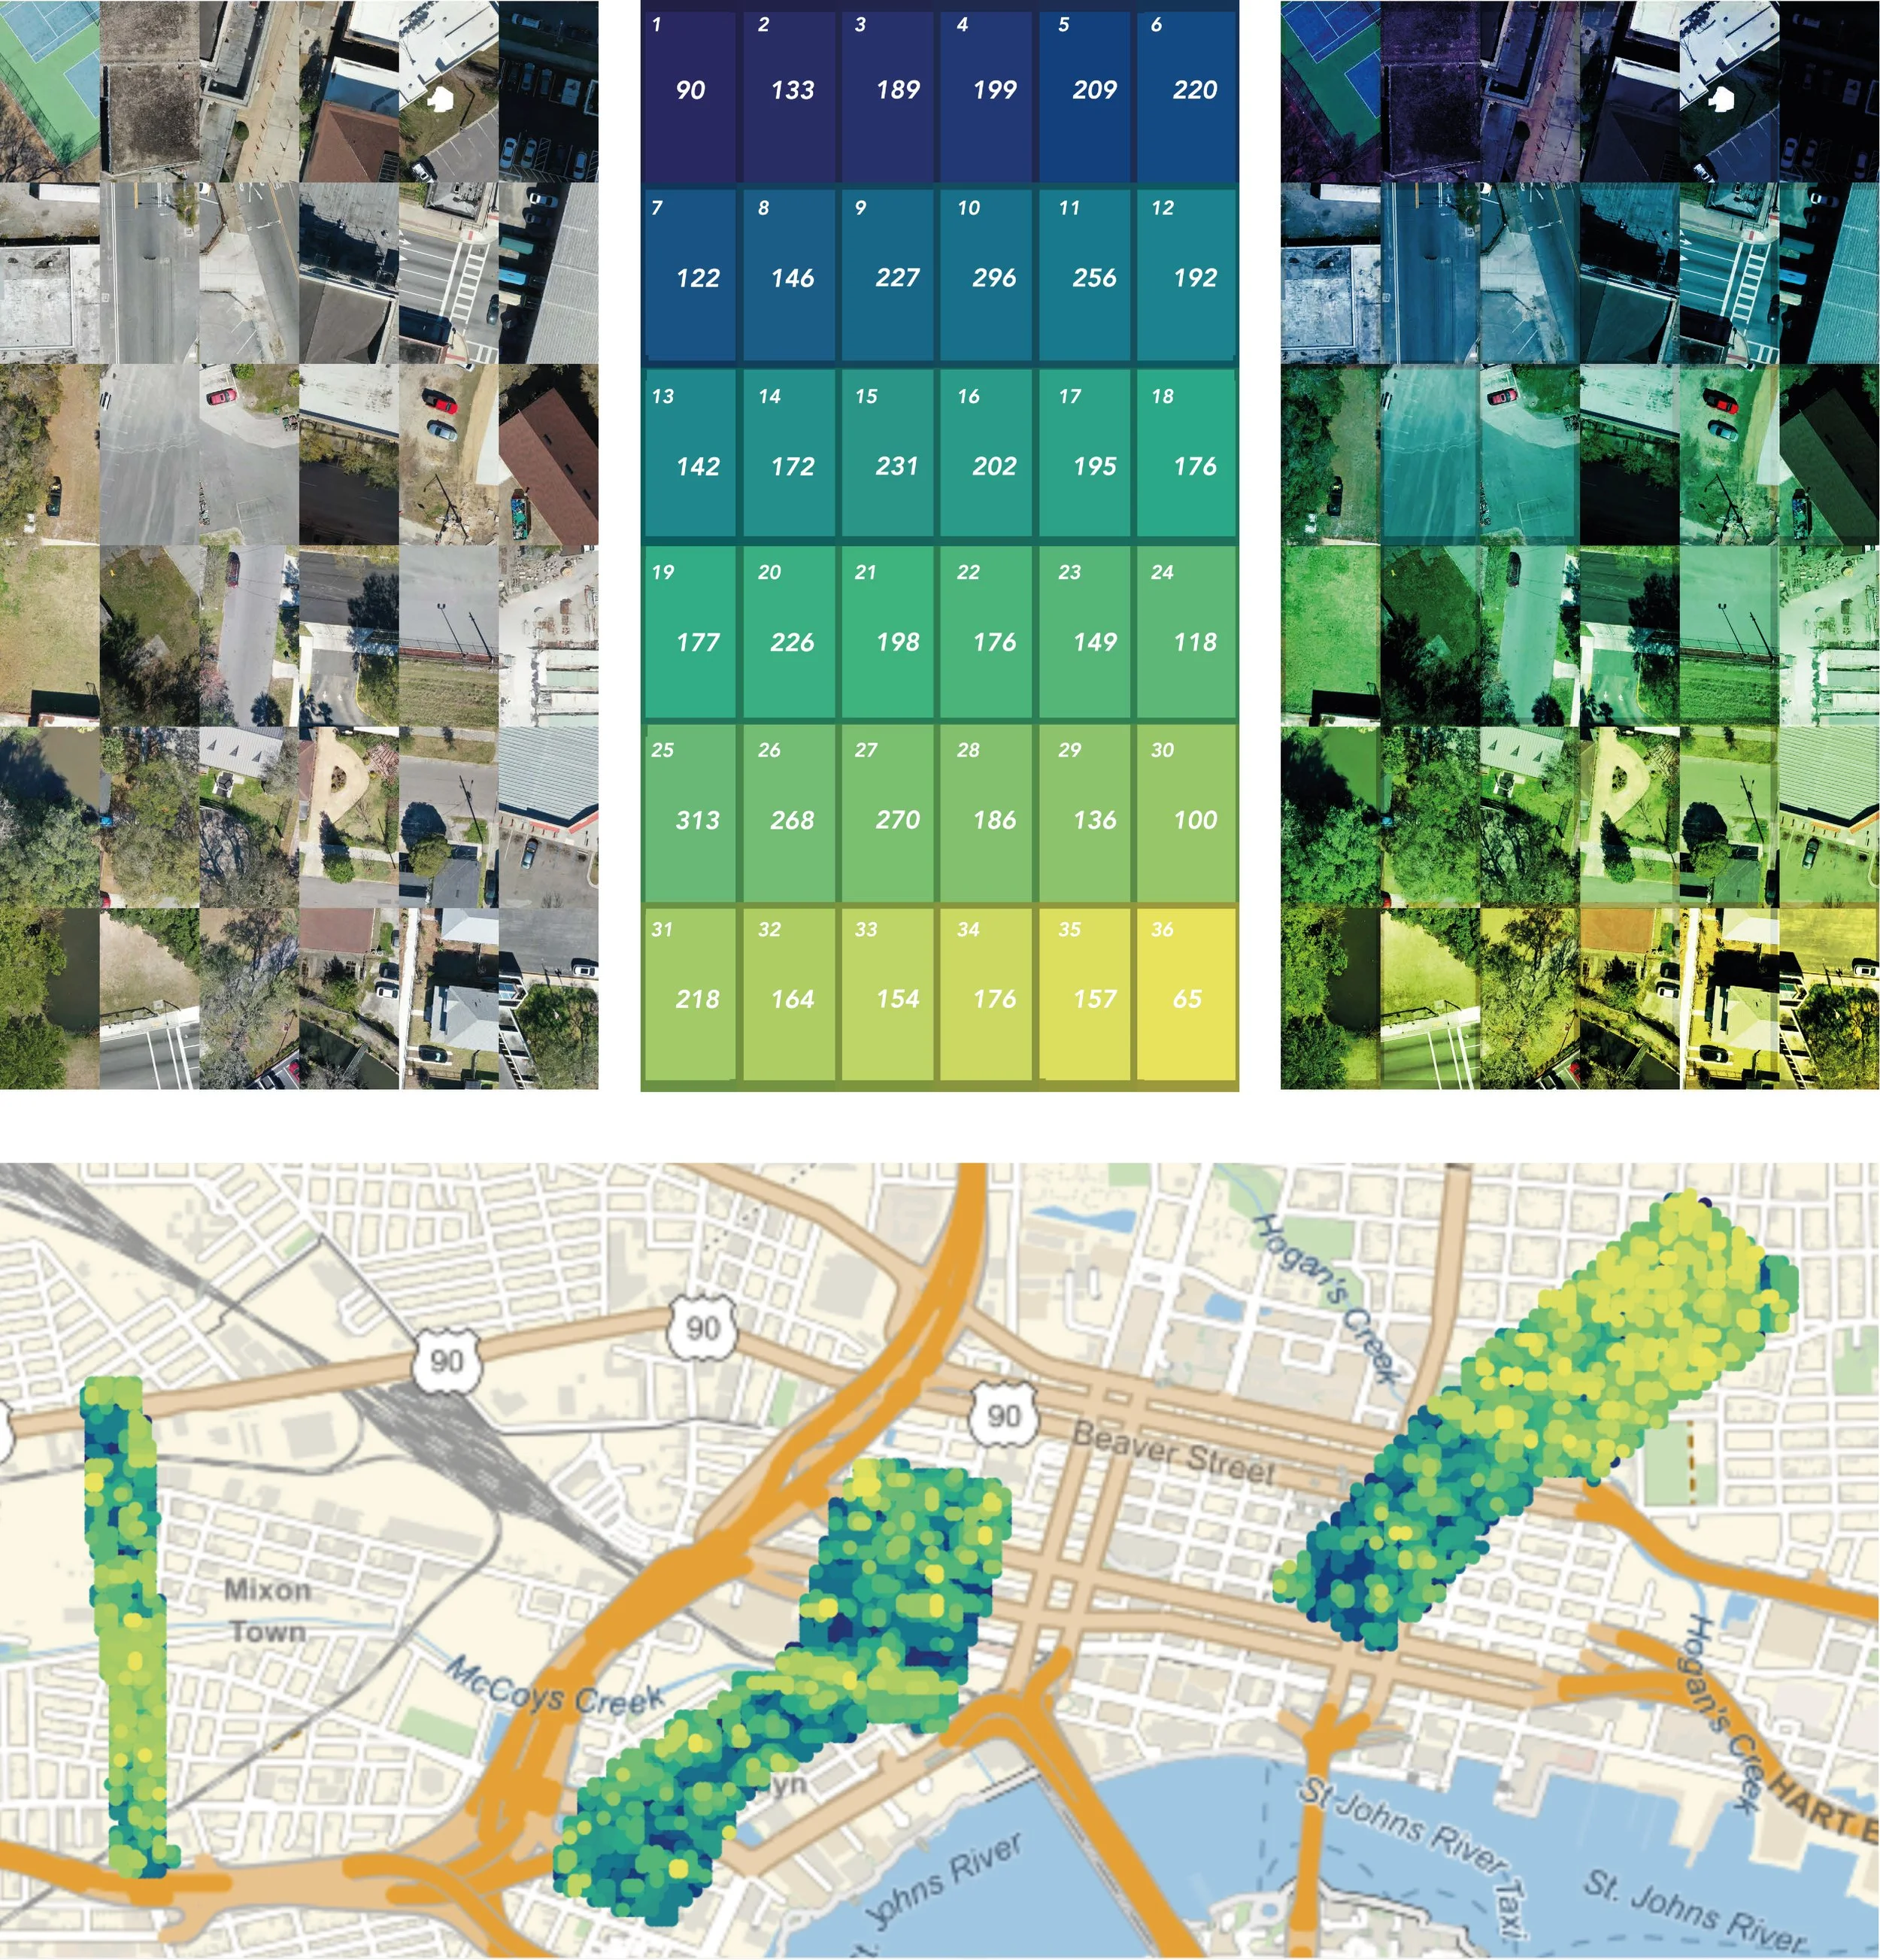
The second set of transects adopted an AI methodology that involves data collection using low altitude aerial drone images across the transects, followed by data processing and representation.
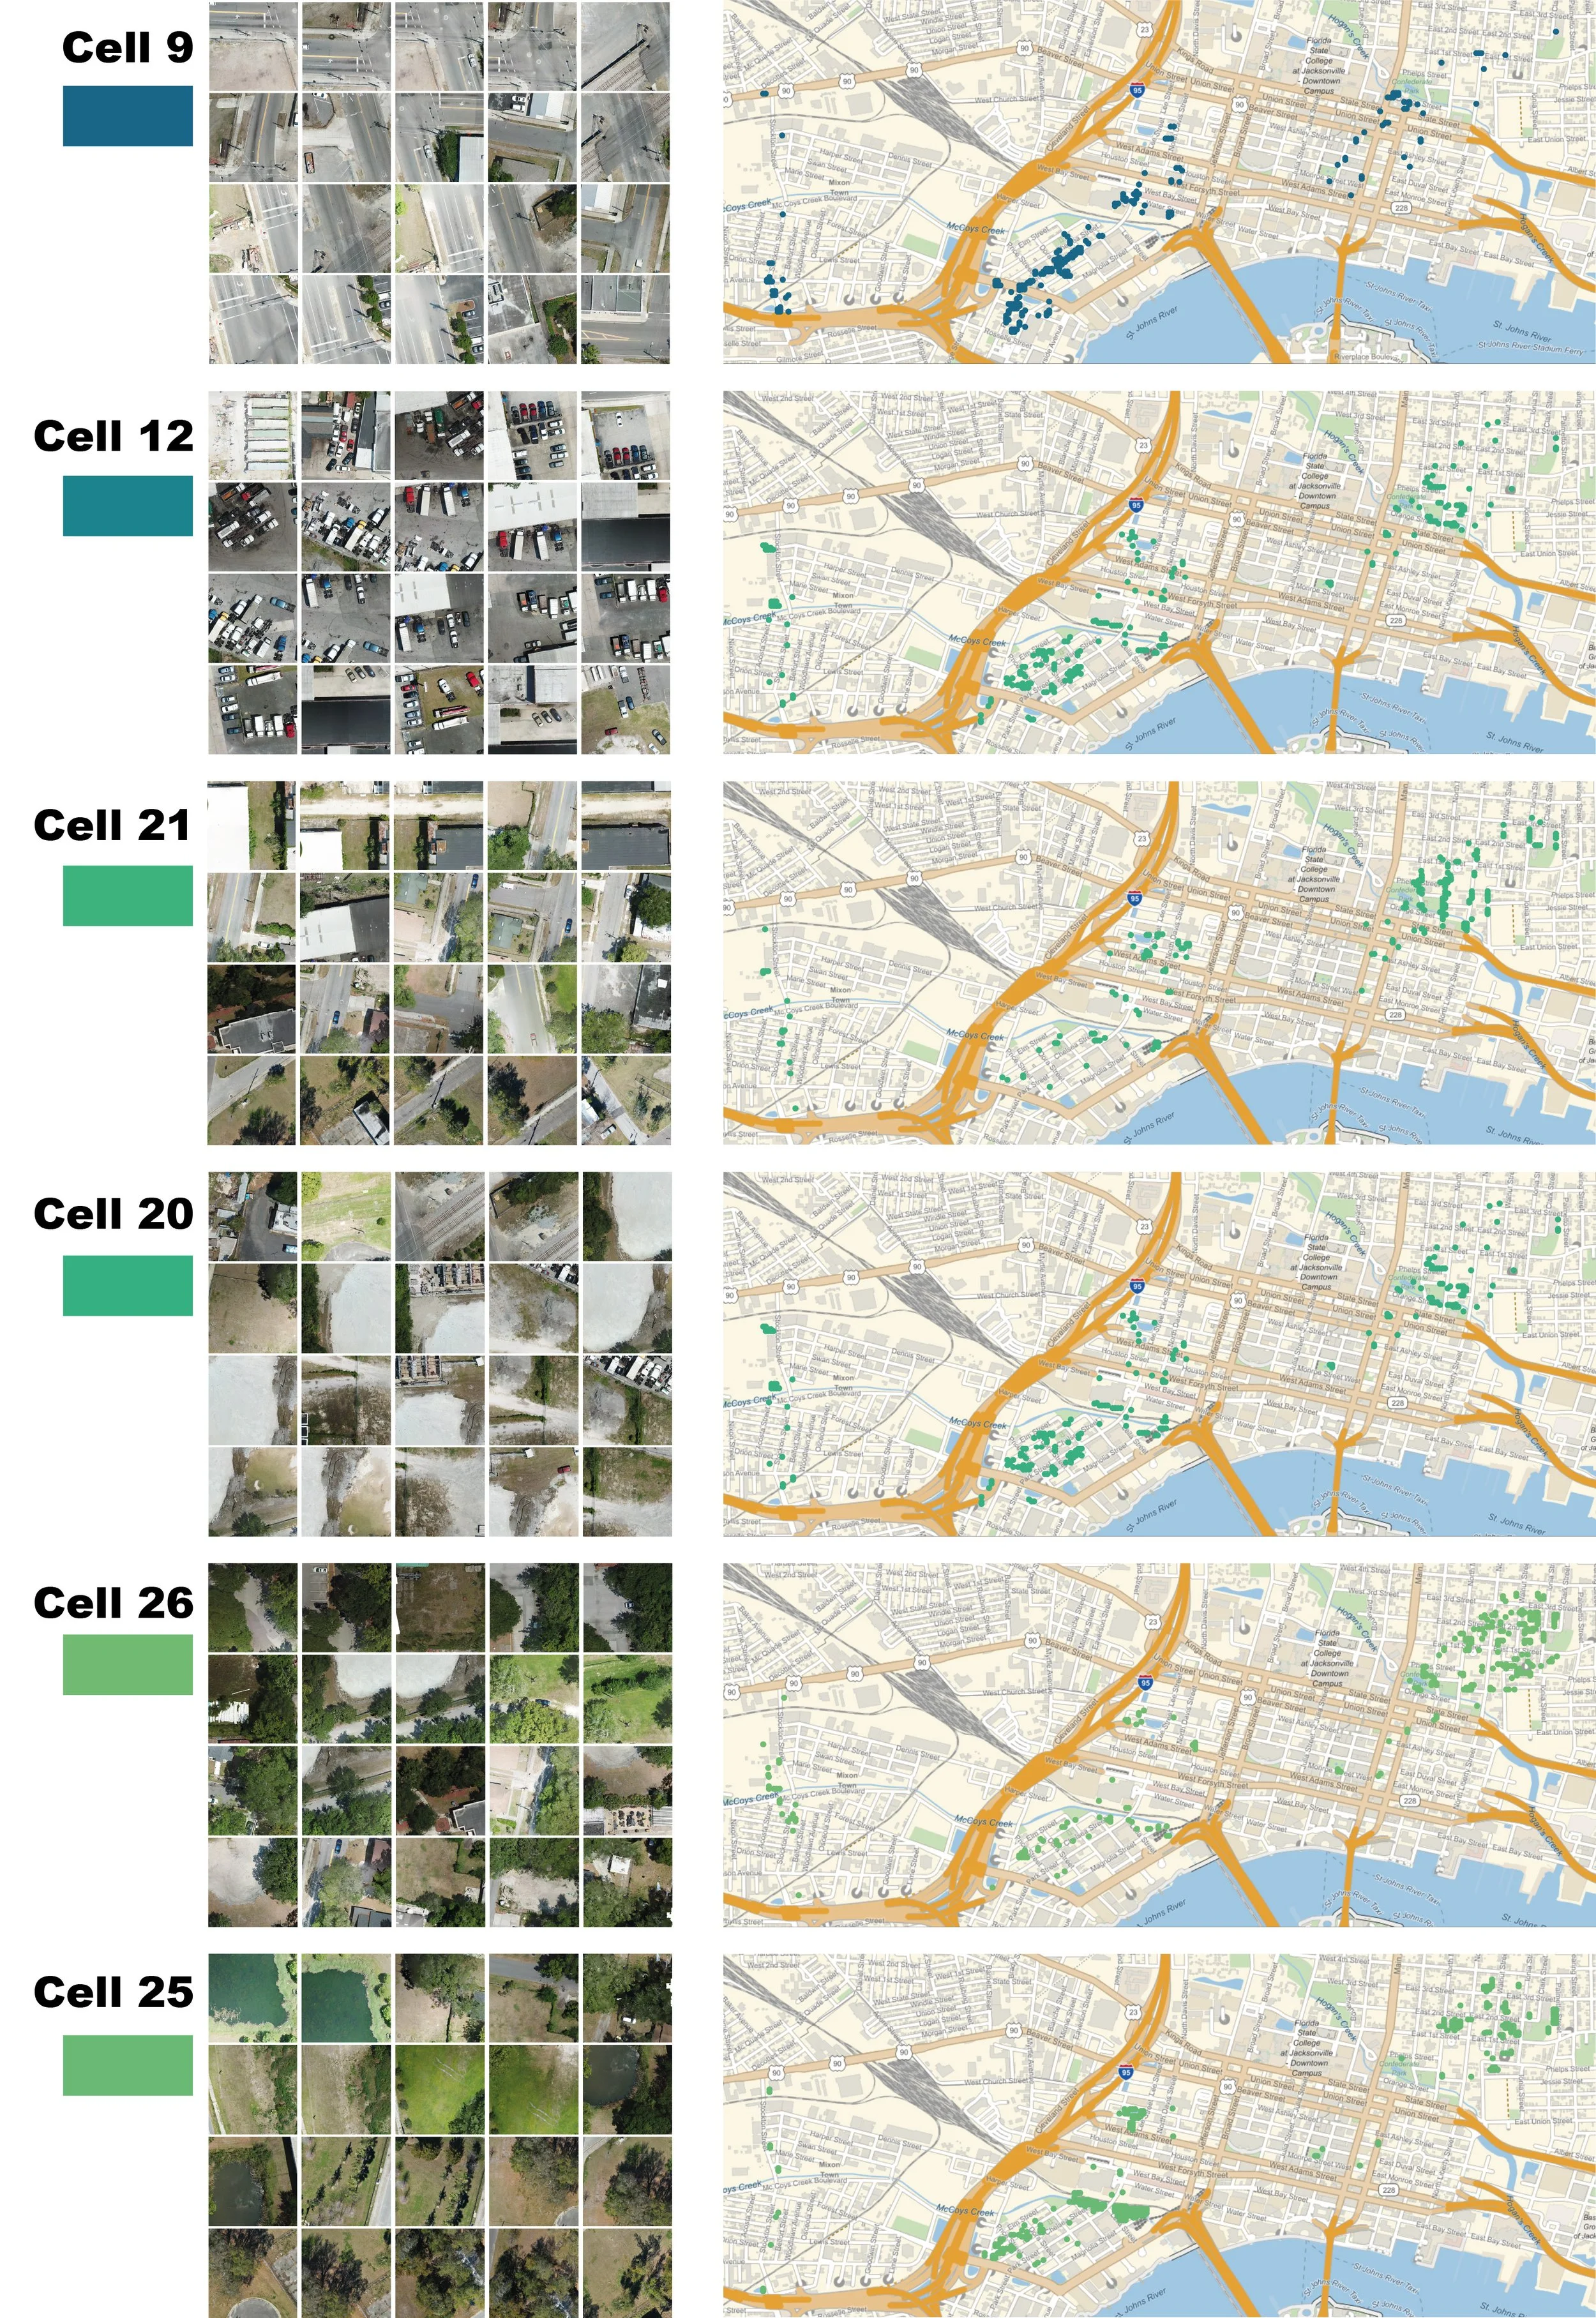
An unsupervised feature extraction process is implemented using a trained VGG-16 network to extract numerical features from the images. The extracted features are then processed using t-Distributed Stochastic Neighbor Embedding (t-SNE) for dimensionality reduction.
A Self Organizing Map (SOM) clustering algorithm is applied to create a similarity landscape, organizing the drone images based on patterns and similarities.
Which then were classified into 6 urban indexes describing the 3 annualized transects.

Findings of study
The experiment’s findings highlight the ability of the ML algorithms to find noticeable patterns of built environment and urban wellbeing indicators from aerial imagery. However, The most important finding of the passage is the ML algorithms' ability to identify gentrification stages using aerial imagery, challenging traditional perceptions of urban wellbeing indicators. This finding unveils the discrepancy between perceived urban well-being indicators such as green urban features and ML-generated patterns where the presence of green urban features was an indicator of gentrification in process.
The combination of machine learning and traditional methods is emphasized as complementary for community benefit.
Gallery