DISASTER RESILIENCE ON COLLEGE CAMPUSES
Promising Applications for Promoting Disaster Resilience on College Campuses
In collaboration with Mobina Noorani, Changjie Chen, Kaleb Smith, and Frank Fernandez
Climate change has made natural disasters increasingly common. Colleges and university campuses face severe threats of closure and damage. When college campuses sustain significant damage, it often takes years for them to recover. Many higher education institutions are located in cities and states that are routinely at risk during hurricane season. Combining this with rising sea levels and more intense storms, there is a growing threat to buildings and human lives. Campus leaders and state policymakers need to focus on promoting disaster resilience to reduce damage from natural disasters.
This chapter considers how higher education leaders can use artificial intelligence (AI) as a tool, among broader efforts, to support disaster resilience. National and global agencies have called for integrating AI and big data into emergency management planning and disaster resilience efforts. However, there is limited attention on how AI can help colleges and universities protect their buildings and students. In the sections that follow, we briefly discuss research on how AI can be used to reduce risks to campuses and provide preliminary findings from our own work training an AI algorithm to map and identify vulnerabilities in the built environment on and around campuses.
Literature Review
Despite the increasing risk of global climate change, most higher education research focuses on campus sustainability or efforts to reduce carbon footprints. A body of work focuses on how national, state, and municipal agencies can adapt to increasing threats from climate change, but relatively little work focuses on disaster resilience in higher education.
Most studies focus on the experiences and actions of people during and after a crisis instead of preparation and disaster resilience. During a crisis, university leaders have to consider more than just buildings. They must weigh many risks and factors — like whether to cancel classes, how to coordinate with city emergency personnel, and how to keep students and staff safe. Since people can evacuate but buildings are immobile, leaders need tools that help them identify which roads, buildings, and infrastructure are vulnerable in order to make it possible to evacuate or access the campus before and after a disaster.
AI facilitates a shift from mitigation and recovery to preparing for and preventing disaster-related damage by leveraging multiple types of data, such as population, geographic, infrastructural, and hazard data.
Some scholars have sought to lay out approaches for how AI should support disaster resilience. They have found difficulties in using AI because it is hard to understand, but they see potential in combining AI with community empowerment.
Methodology
The project was executed in three stages: First, a database of campus-built environmental data was created using aerial imagery and human-scale data from street view images to capture both large- and small-level flood risks.
Second, a user-friendly web interface was developed to integrate and display this data, allowing users to view critical infrastructure and potential flood zones at both scales. Third, a 2-day workshop was conducted with university students and faculty to gather feedback on flood risk perceptions. The data collected were analyzed to identify common themes and specific risk factors, providing insights into participants’ perceptions of security and the factors influencing them.
Creating a Database of Campus-Built Environmental Data
We collected Google Street View (GSV) maps, flood maps, density maps, and digital elevation models (DEMs), which represent the bare earth or surface topography of the Earth, excluding trees and buildings. We used the Google API and ArcGIS to gather corresponding street views and aerial imagery. To extract the road network of each campus, we used the OpenStreetMap (OSM) API and created a grid to determine the geocoordinates. We collected 675,486 images from 30 universities in Gulf Coast states, including 96,498 satellite images, 192,996 street view images, 96,498 flood maps, 96,498 density maps, and 96,498 DEM maps.
Three kinds of map data were combined: flood risk maps, population density estimates, and detailed elevation/terrain data. These datasets came from government and mapping services. For every location studied, a small equal-sized square area around it was extracted so all the data could be compared consistently within the same space.
Web Interface Development
The web interface is designed to be user-friendly and visually informative, with clear and easy navigation between different views and data layers. The interface displays inputs at large and small scales. Remote sensing imagery from satellite images, flood maps, density maps, and DEMs highlights potential flood zones and vulnerable regions. GSV images provide a human-level perspective to understand the immediate environment and specific risk factors.
Second, the web interface included a survey to capture how students and faculty perceive the risk of flooding and identify specific concerns regarding campus safety during flood events. The responses were turned into data to pinpoint the exact locations of concern raised by participants.
The web interface allowed us to pair geographic data with human observations about risks to improve campus safety and preparedness.
Designing the Web-Based Interface to Collect Data from Campus Stakeholders
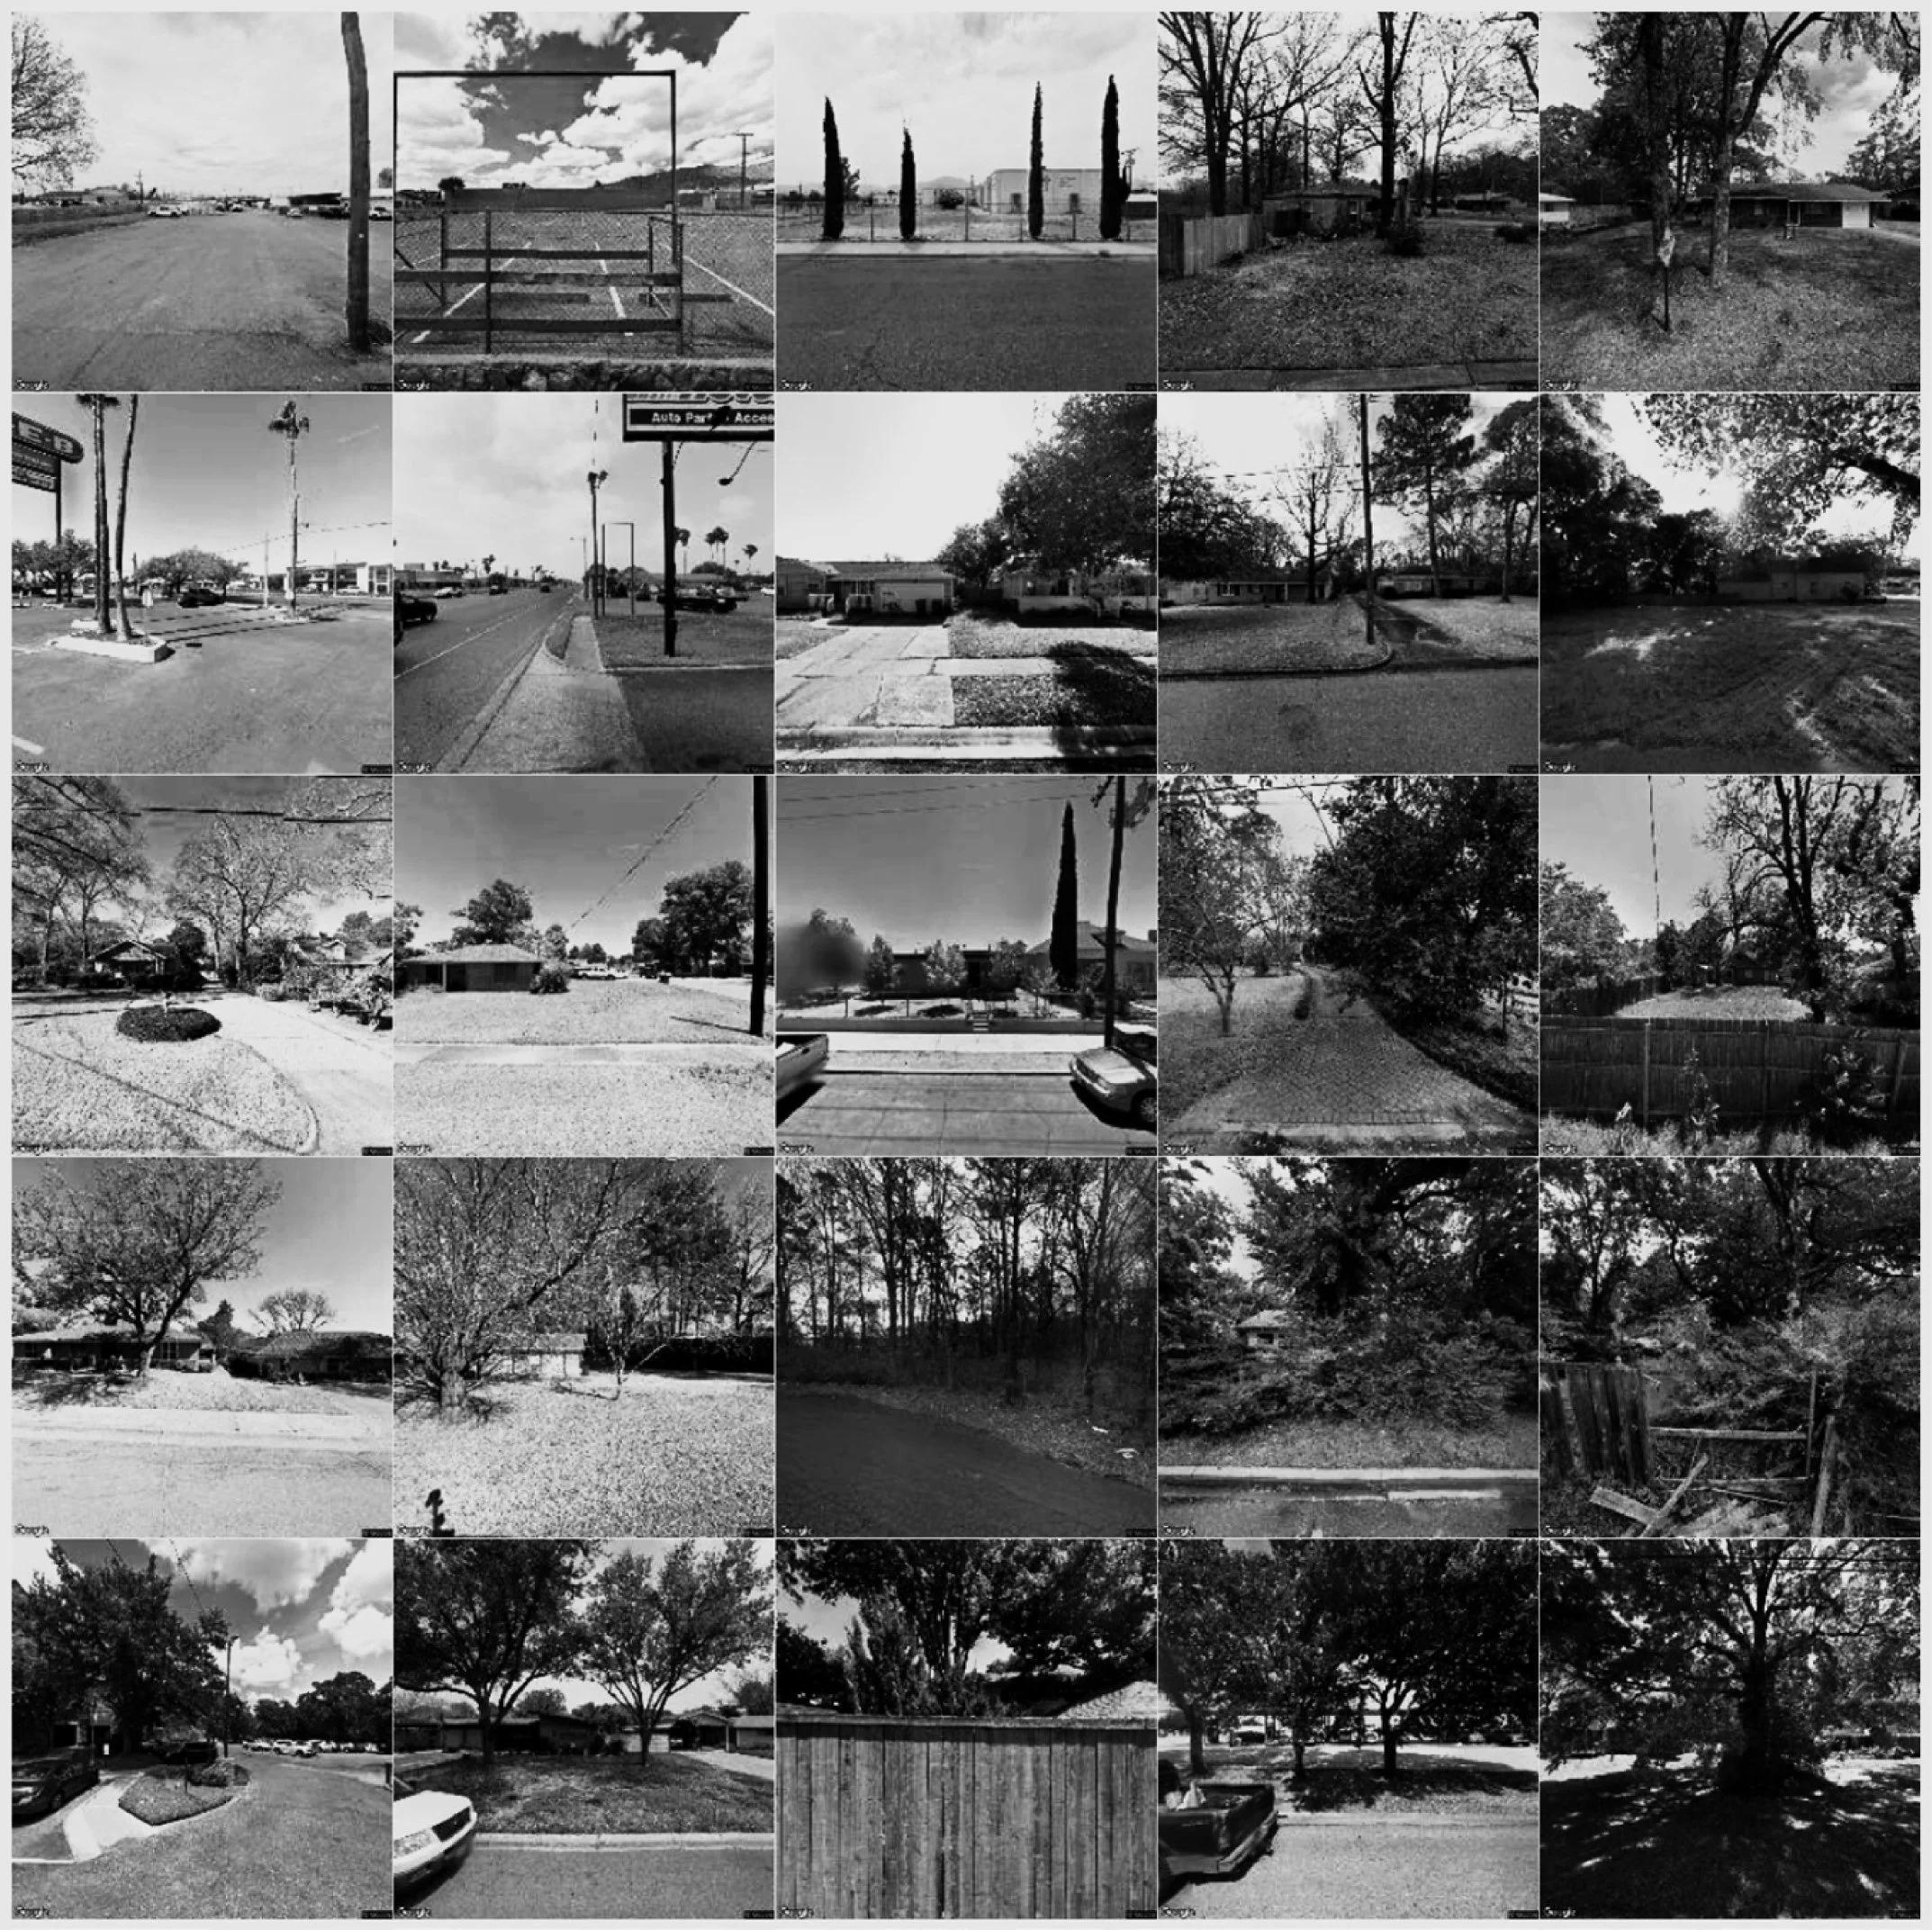
The web interface organizes the collected dataset using an unsupervised clustering algorithm — self-organizing map (SOM) — to reduce the number of examples shown to participants by selecting the most representative ones. This approach helps create a grid (Figure 1) that highlights the most representative campus environments, allowing us to efficiently organize similar campus facilities based on built environment imagery.
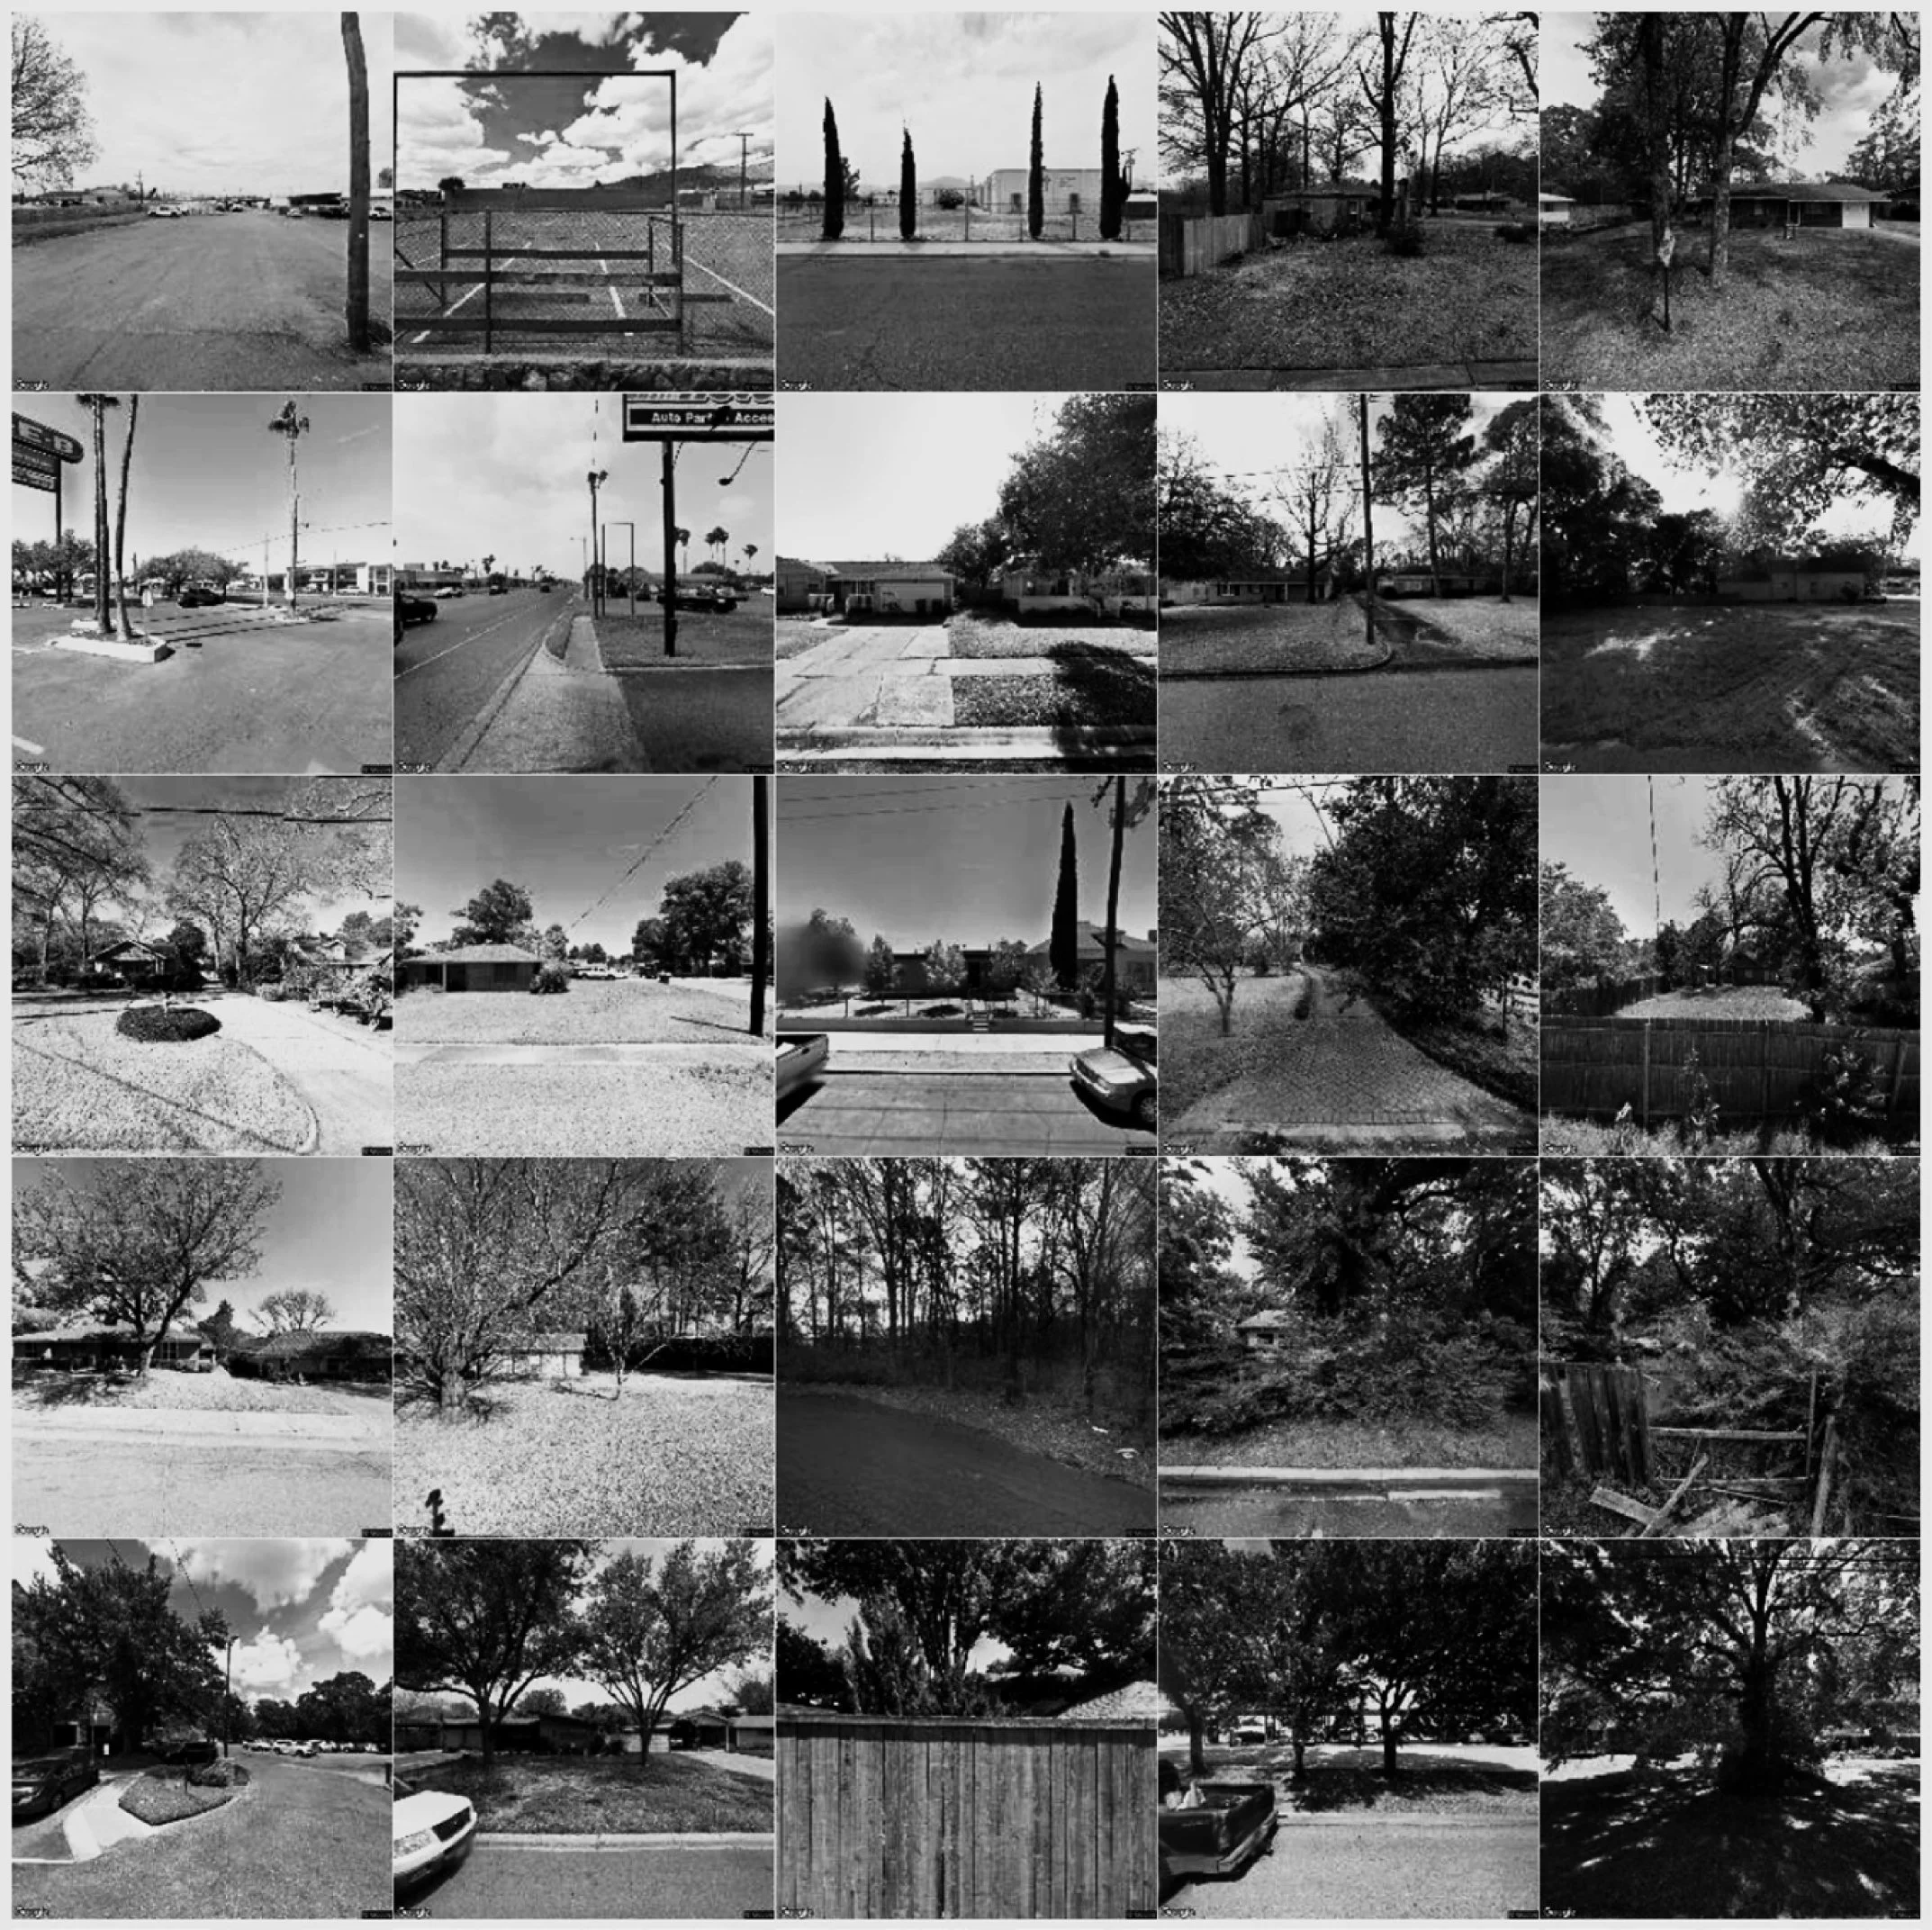
Figure 1. Self-organizing maps for Google Street View images.
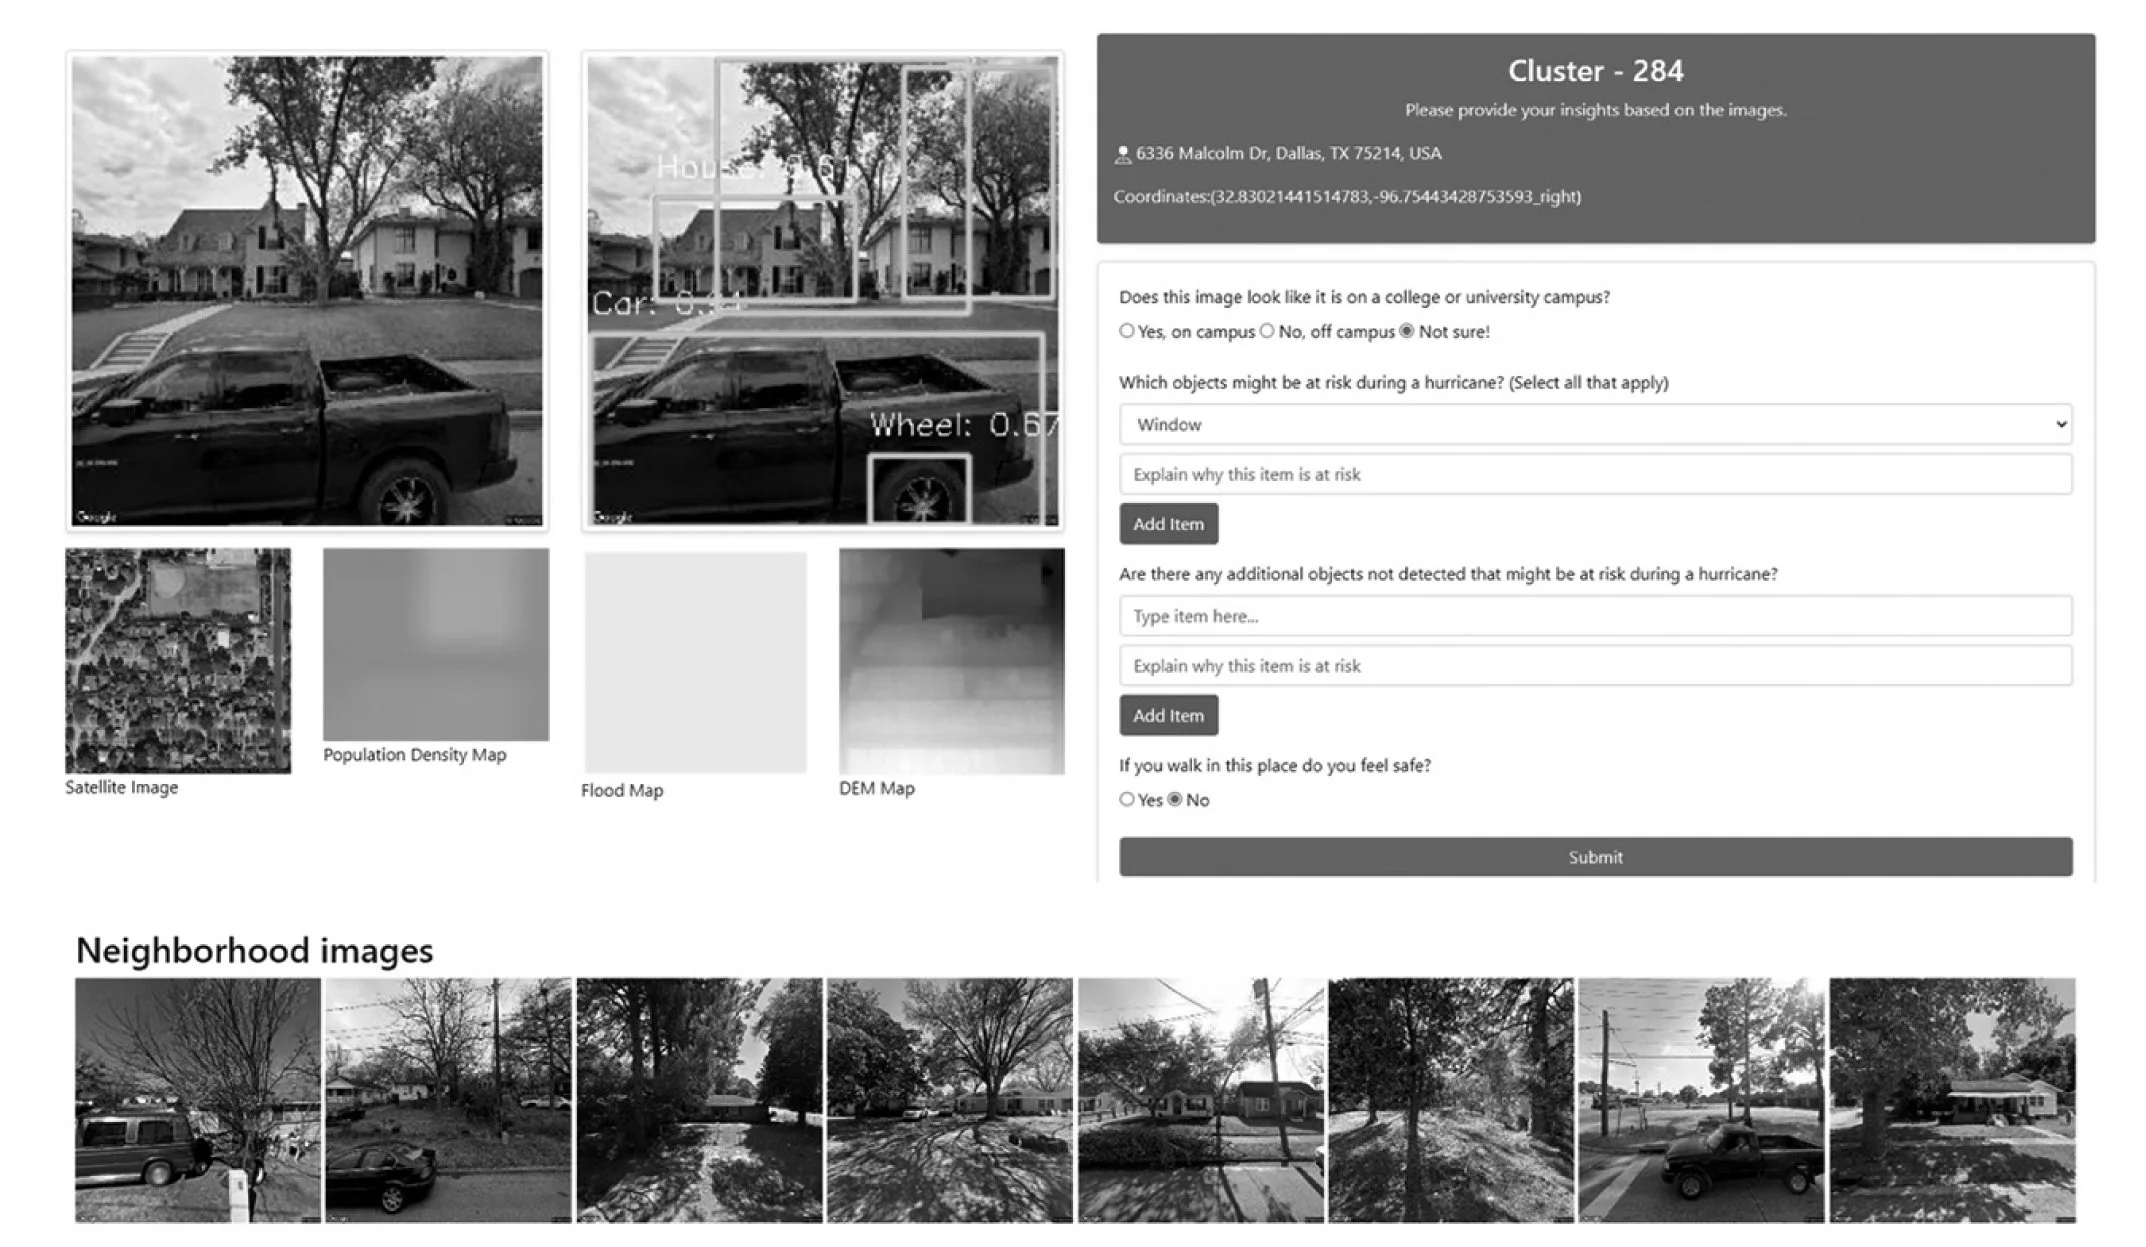
The interface shows a trained SOM that visualizes the street view images closest to the best matching unit (BMU) per cell. Clicking on an image takes the user to another window where the image enlarges, and all other information from the site is shown. The website displays a street view image side by side with the same image with objects automatically identified. We filter the objects into the following categories:
• Sill height: window
• Building typology: building, office building, skyscraper, house, tower
• Street: road, sidewalk, street
• Structure attached to adjacent building: porch, stairs, door, window, door handle
• Vehicles and related: land vehicle, truck, bus, car, van, train
• Electricity pole: electricity, electric network, cable, power cables, power grid
• Fence
• Outdoor decor
• Signage: traffic sign, stop sign, billboard
• Streetlight
The second window of the web interface is shown in figure 10.2. The second window includes additional street view images from surrounding places. With this information, students were asked to answer the following questions:
• “Does this image look like it is on a college or university campus?”
• “Which objects might be at risk during a hurricane?”
• “Are there any additional objects not detected that might be at risk during a hurricane?”
• “If you walk in this place, do you feel safe?”
Responses were recorded based on geolocation, and all similar locations were grouped together.
Workshop and Data Analysis
Students and faculty interacted with the web interface during a two-day workshop, providing feedback on their perceptions of flood risks. We analyzed the survey answers to understand the primary concerns with the built environment in the potential case of a flood.
Throughout the workshop, students from a variety of disciplines provided unique insights into risk perception during a flooding event.
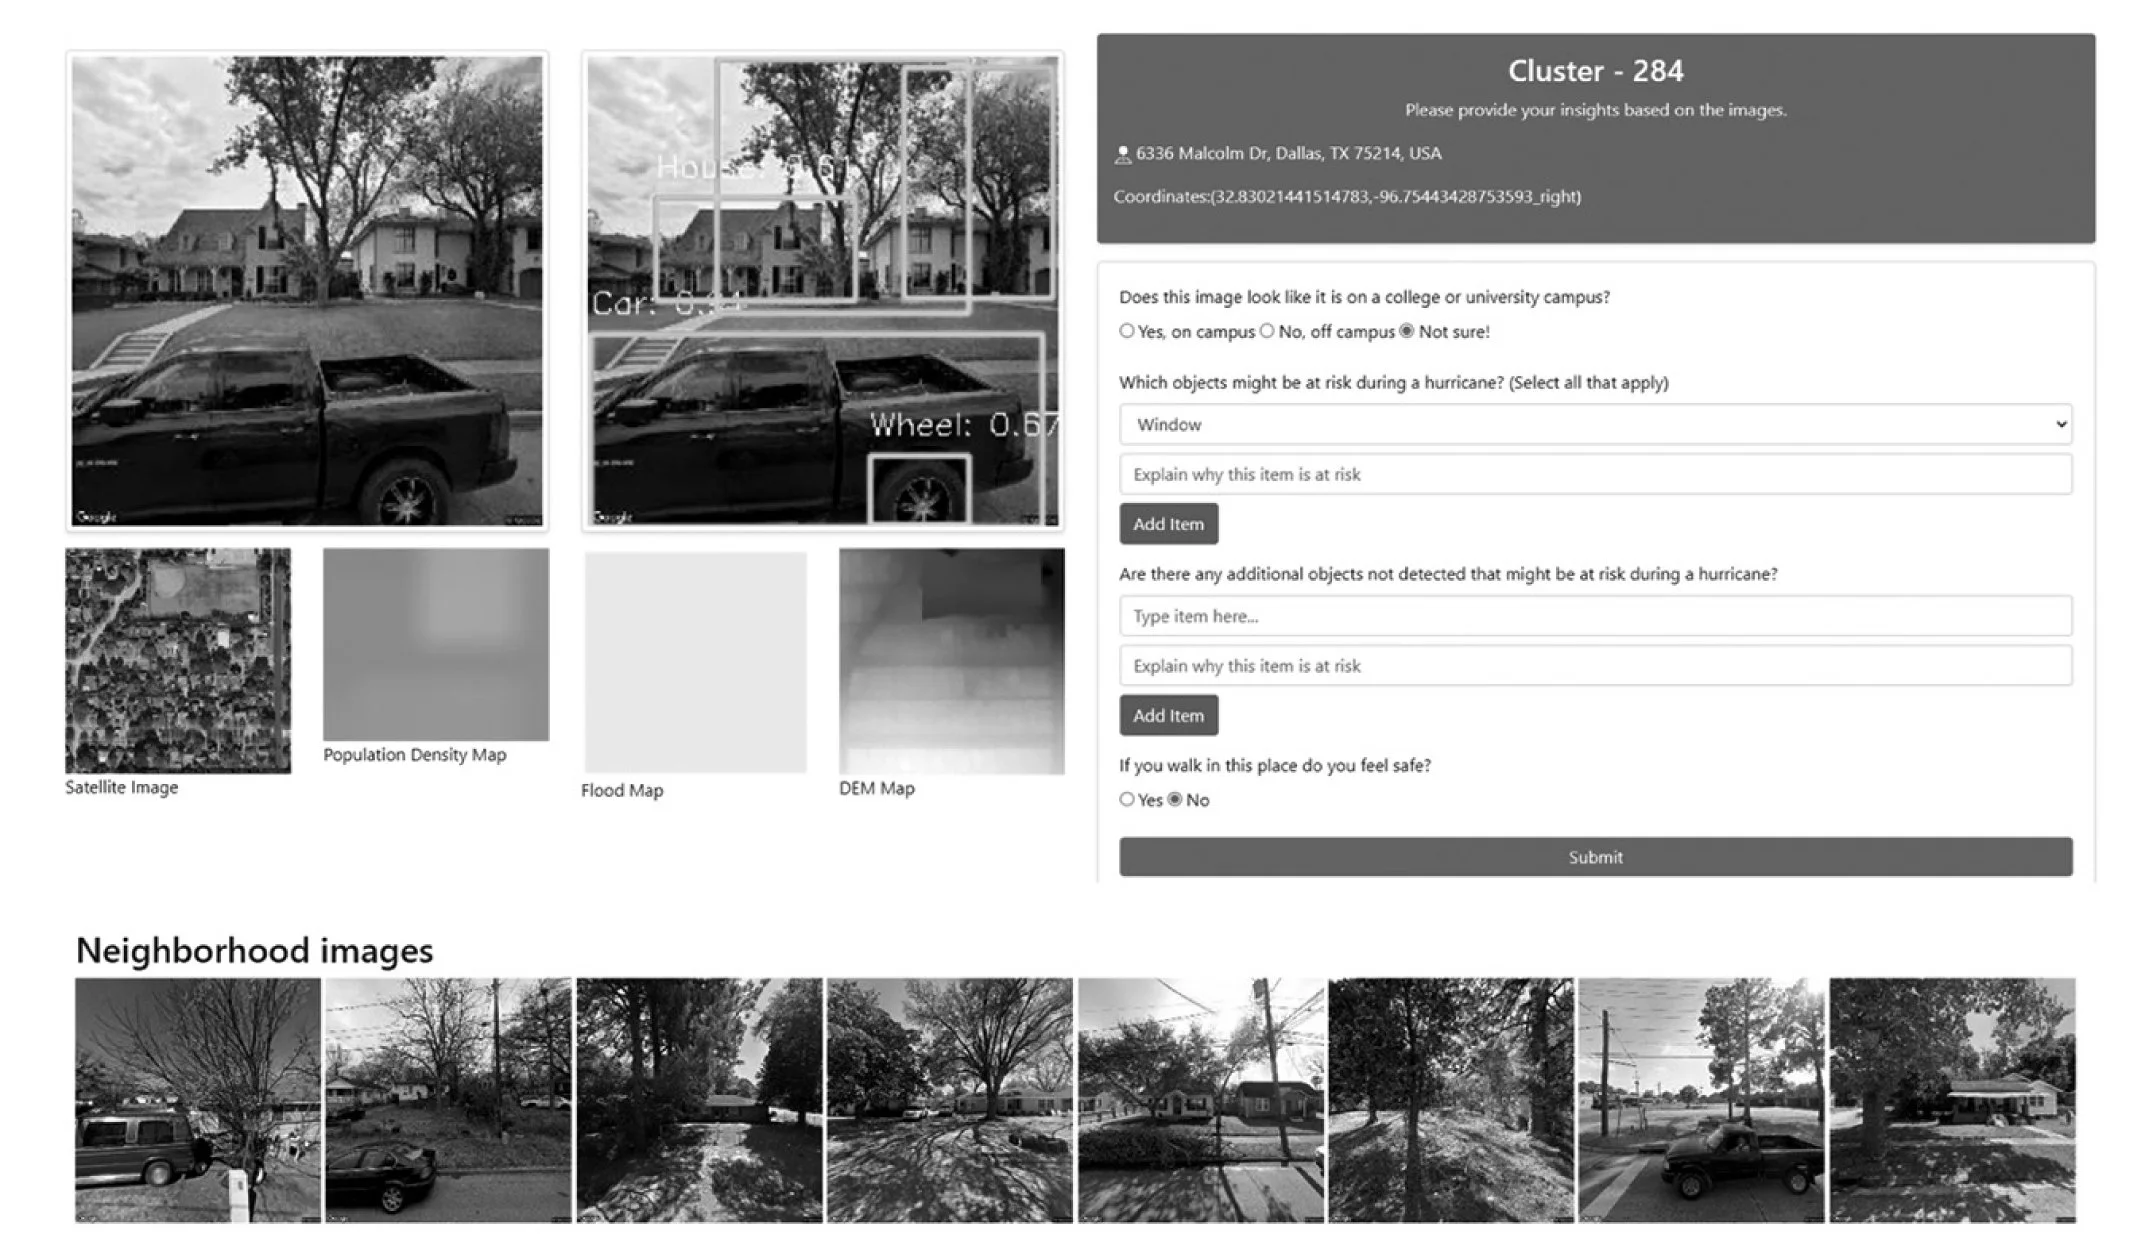
Figure 2. Labeling interface per cell of the self-organizing map.
Ethical Considerations and Participatory Design Approach
This project followed an ethical participatory AI design approach in which university students and faculty were both study subjects and knowledge co-creators.
Results
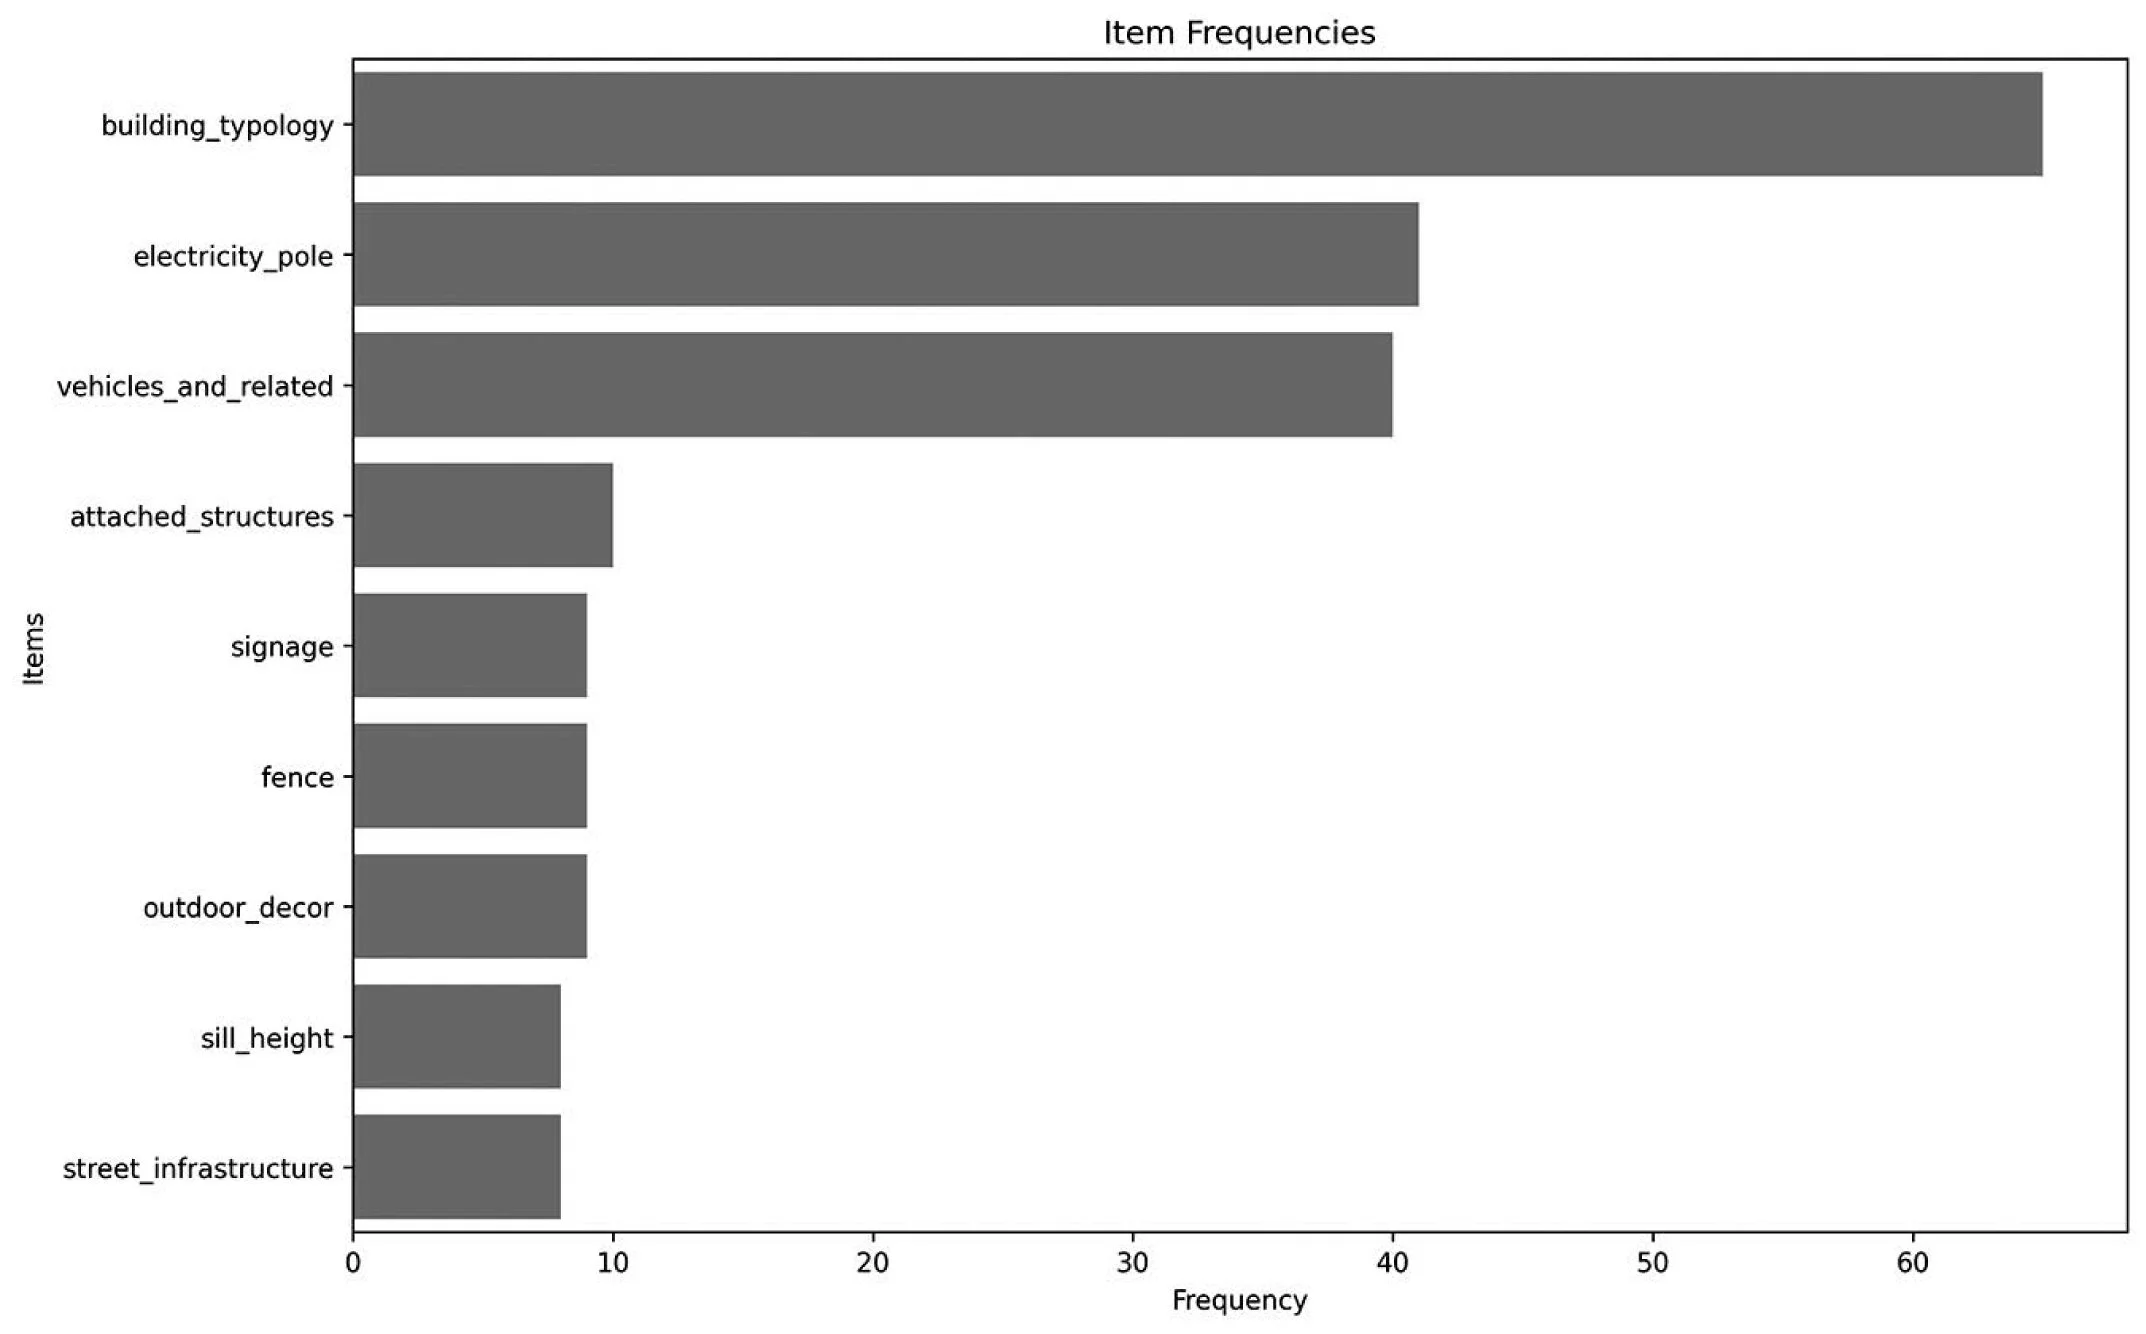
Attendees mentioned that some street view images did not resemble typical campuses, which may be due to seeing campuses and campus-adjacent neighborhoods from other cities and states than their own university (figure 3). The text analysis provided valuable insights into the common concerns and themes within the dataset (figure 4). The frequency analysis highlighted the most frequently mentioned terms used to describe images of campuses and their surrounding areas.
The heatmap revealed clusters of high-frequency keywords associated with specific items, providing clear indications of common hazards and concerns related to objects such as cars, buildings, and power cables (figure 5)
• Buildings are commonly associated with terms like “damage” and “flood,” indicating concerns about structural integrity.
• Vehicles are often linked to “damage” and “risk,” suggesting worries about vehicle safety.
• Electricity pole frequently appears with “fall” and “power,” highlighting the risks associated with power infrastructure during adverse conditions.
This detailed analysis helps identify priority areas for risk assessment and mitigation efforts.

Figure 3. Campus stakeholders’ perceptions of safety during flooding and their perceptions of whether street view images resemble a campus.
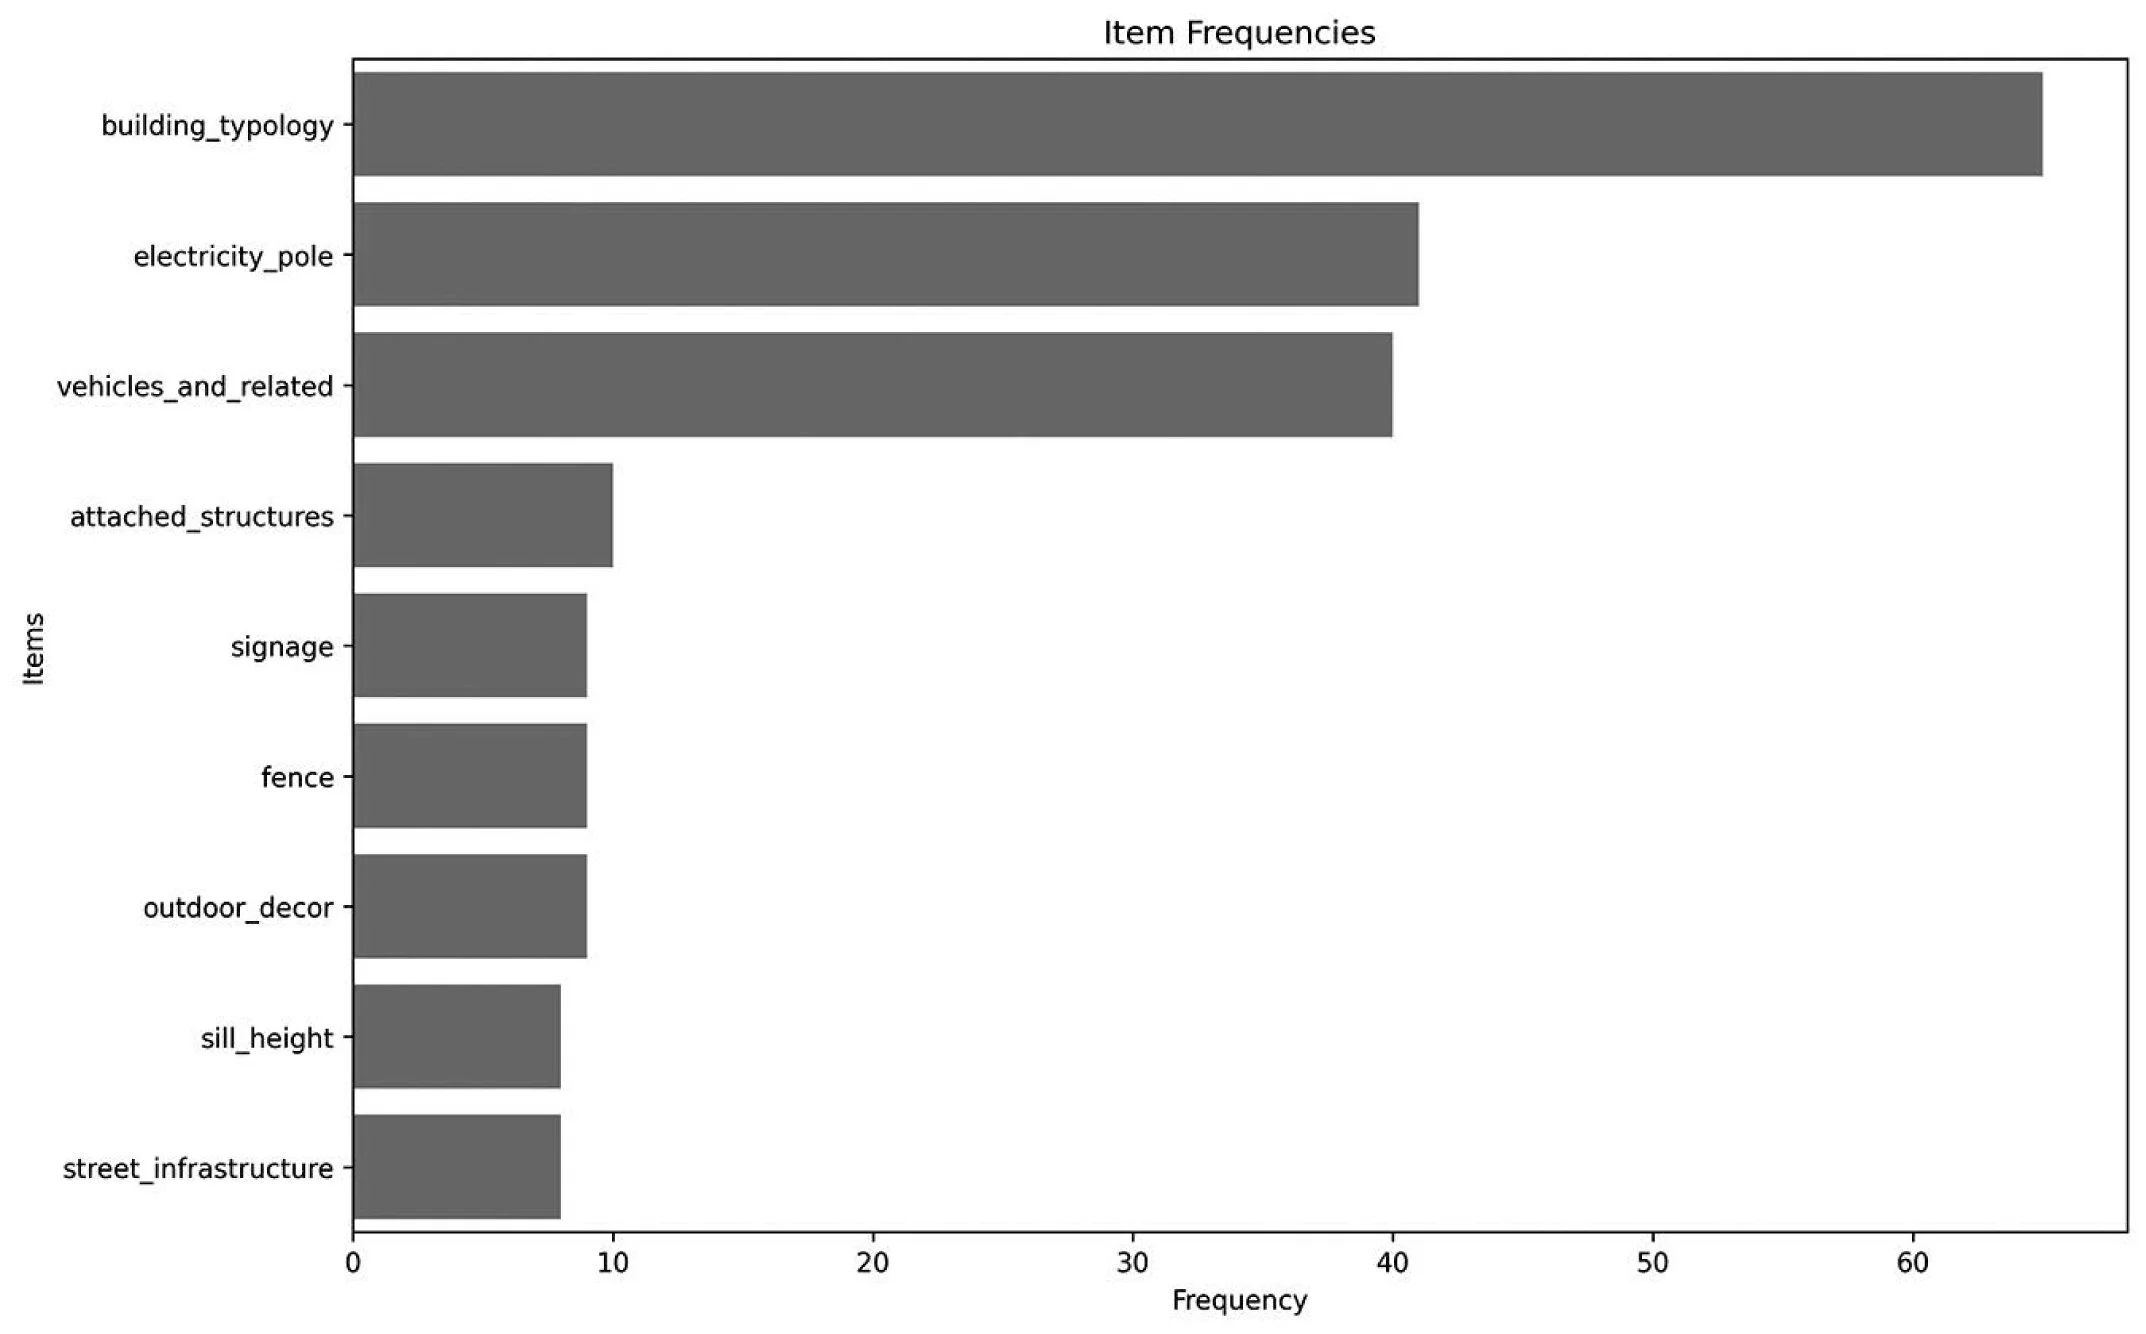
Figure 4a. Descriptions of campus and campus-adjacent images and perceptions of vulnerabilities.
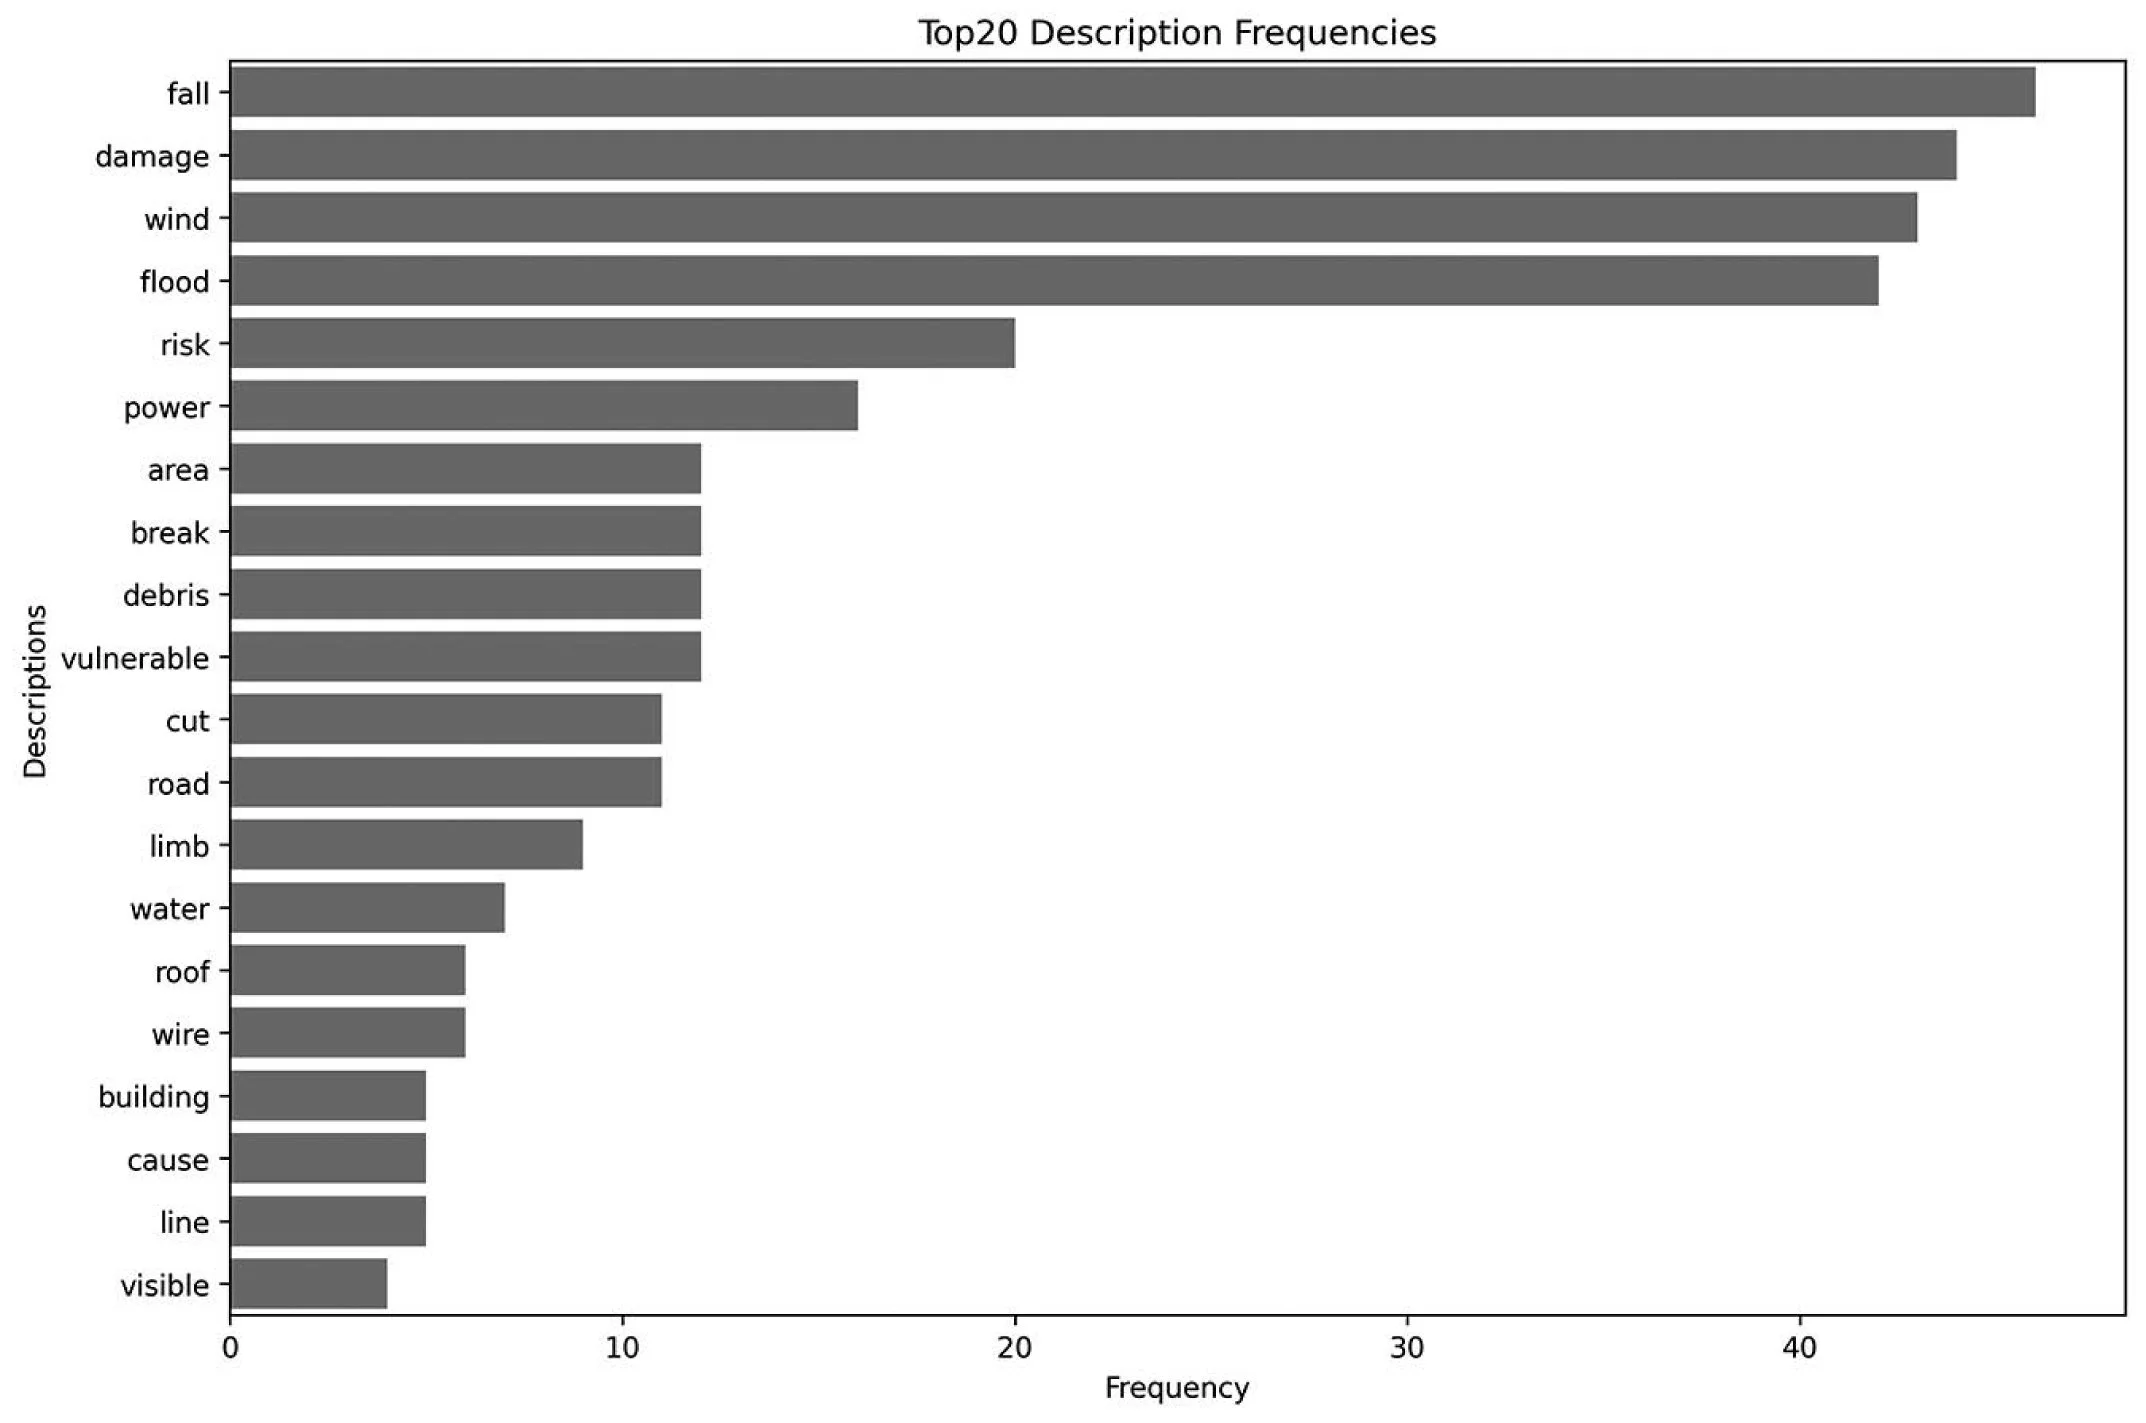
Figure 4b. Descriptions of campus and campus-adjacent images and perceptions of vulnerabilities.
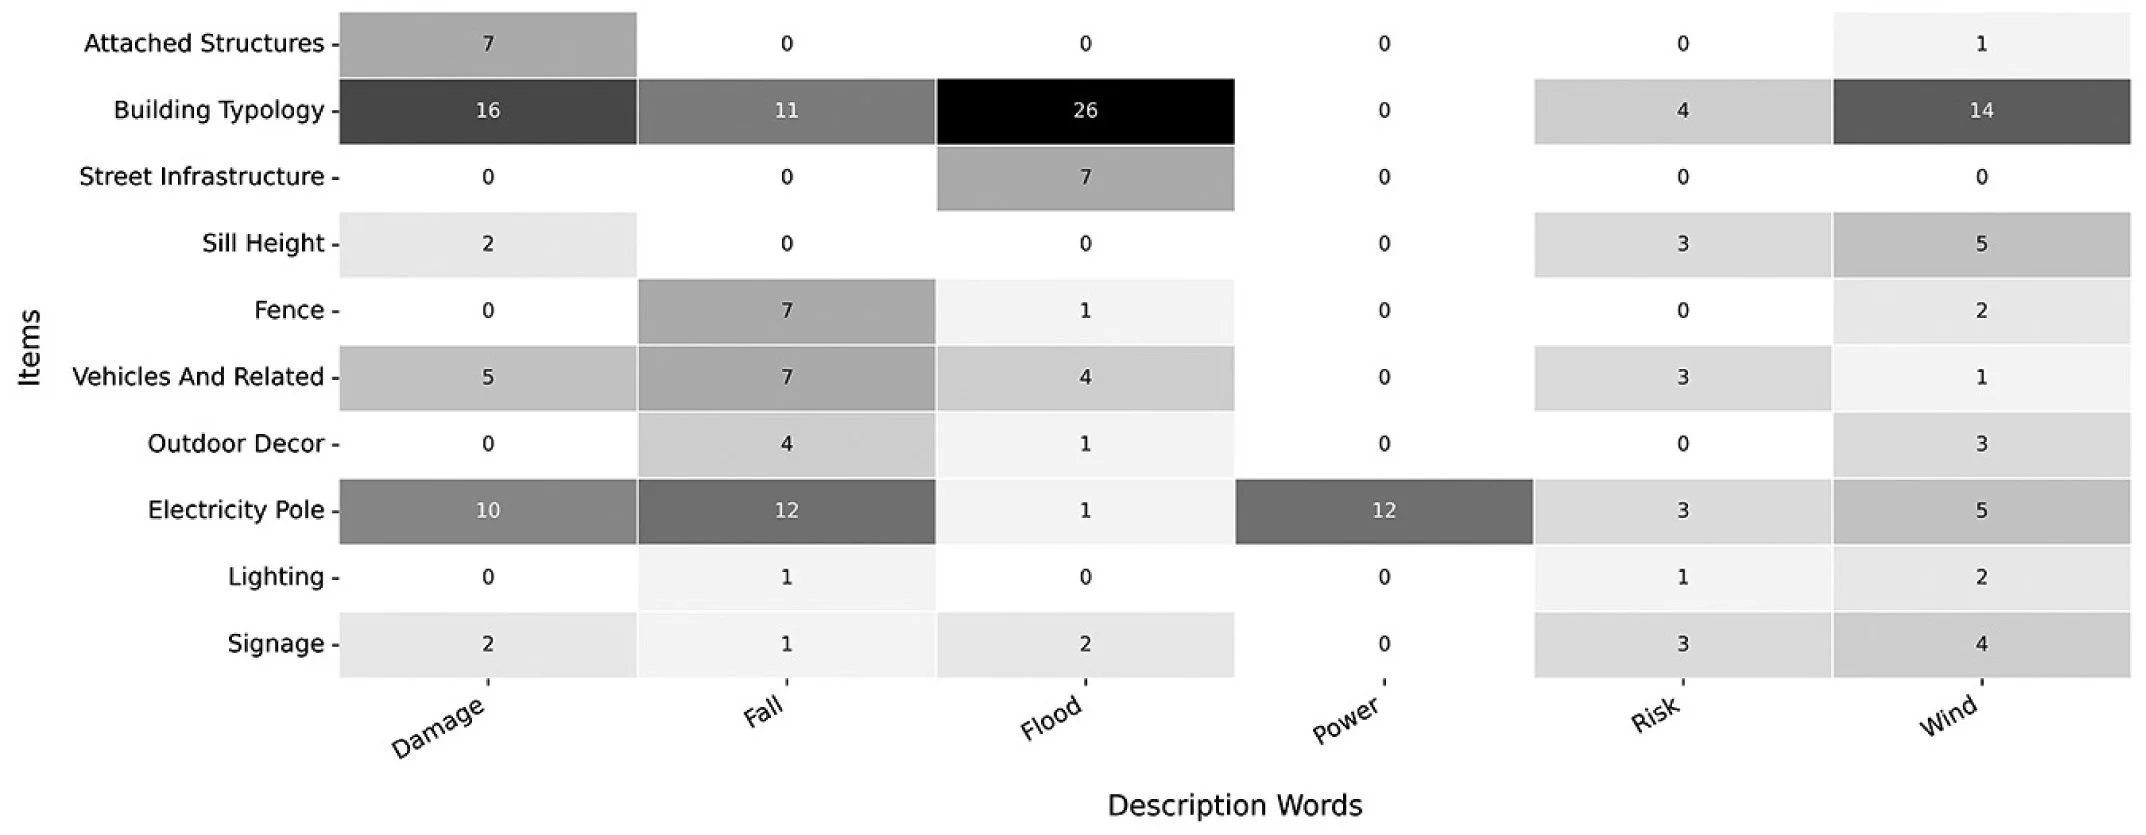
Figure 5. Heatmap of most frequent items and descriptors words.
Additional Perceptions of Campus Safety
Figure 6 contrasts locations perceived as safe (displayed on the right) and those perceived as unsafe (on the left). Large parking lots, large-foot print buildings, and the presence of large trees frequently characterize unsafe areas. Conversely, safe areas are typically densely populated with high activity.
Identifying these attributes can guide urban planners in designing safer communities by minimizing features associated with unsafe perceptions and promoting those linked to safety.
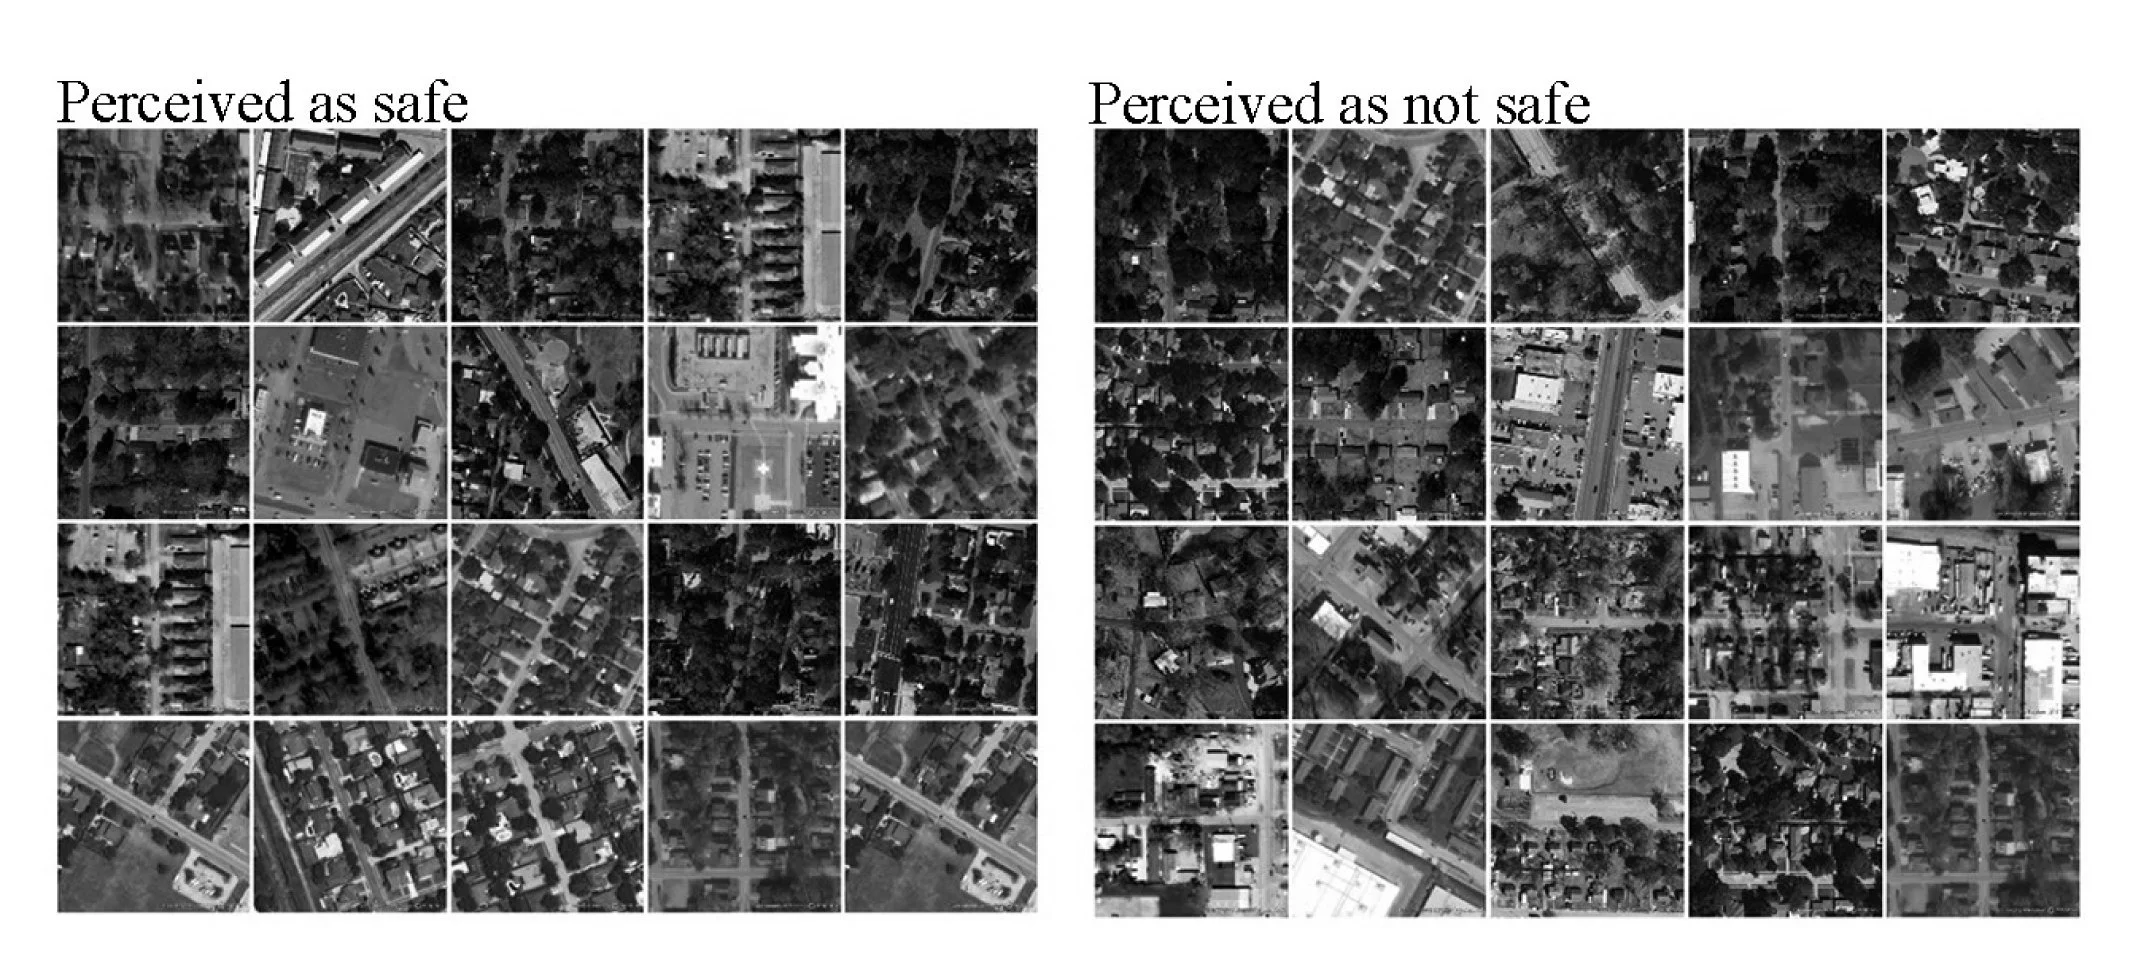
Figure 6. Areas perceived as safe and unsafe based on satellite view images, derived from student surveys and risk analysis.
Discussion and Conclusion
In conclusion, our analysis highlights the need for a nuanced approach to urban design, where the presence and arrangement of specific elements can significantly impact the perceived safety of an area. Although this pilot work focused on risks associated with hurricanes and flooding, preliminary findings suggest that AI approaches can be used to assess and improve campus safety and accessibility more generally. Our interface allows for comparison of user-perception data with objective flood hazard layers, enabling future research to visualize and analyze mismatches between where students feel unsafe and where flood risks are highest. Such comparisons could help planners prioritize interventions in both high-risk and high-concern areas. These approaches will be needed to address the increasing dangers that campuses will face from natural disasters throughout the 21st century.
Gallery