
A FRAMEWORK TO ASSESS FOOD SECURITY
Management of agricultural resources with automated aerial imagery detection
In collaboration with Guo Zifeng
The acquisition of data through remote sensing represents a significant advantage in agriculture, as it allows researchers to perform faster and cheaper inspections over large areas. Currently, extensive researches have been done on technical solutions that can benefit simultaneously from both: vast amounts of raw data (big data) extracted from satellite images and Un-manned Aerial Vehicle (UAV) and novel algorithms in Machine Learning for image processing. In this experiment, we provide an approach that fulfills the necessities of rapid food security, assessment, planning, exploitation, and management of agricultural resources by introducing a pipeline for the automatic localization and classification of four types of fruit trees (coconut, banana, mango, and papaya) and the segmentation of roads in the Kingdom of Tonga, using high-resolution aerial imagery (0.04 m).
We used two supervised deep convolutional neural network (CNN): the first, to localize and classify trees (localization), and the second, to mask the streets from the aerial imagery for transportation purposes (semantic segmentation). Additionally, we propose auxiliary methods to determine the density of groupings of each of these trees species, based on the detection results from the localization task and render it in Density Maps that allow comprehending the condition of the agriculture site quickly. Ultimately, we introduce a method to optimize the harvesting of fruits, based on specific sceneries, such as maximum time, path length and location of warehouses and security points
Located in the Pacific Ocean, the Kingdom of Tonga extends over an area of 362,000 km2. With a population of 107.122 inhabitants in 2016, 58.4% of its population depends on agriculture and forestry as a pri mary source of income and a key driver for economic growth. Its most prominent agricultural products are bananas, coconuts, coffee beans, vanilla beans, and roots such as cassava, sweet potato, and taro Utilizing UAVs, high-resolution imagery over satellite images, the latter is easily affected by cloudy environments. Also, freely available satellite images have lower resolution than UAV imagery. The imagery was captured in October 2017 and was made available in early 2018 as part of an Open AI Challenge coordinated by WeRobotics, Pacific Flying Labs, OpenAerialMap, and the World Bank UAVs for Disaster Resilience Program. A total of 80 km2 of high-resolution (under 10 cm) aerial imagery was obtained from the Kingdom of Tonga, covering four areas of interest (with a combination of rural and urban areas).
We created the training data by selecting the imagery from the 50 km2 area with 8 cm of precision and further used it in the first supervised CNN. We obtained labeled imagery through the Humanitarian OpenStreetMap community, where experts label every type of tree from this aerial imagery with these tree classes: coconut, banana, mango, and papaya. To prepare the training data for the first CNN model, we split the original full-size aerial imagery into square patches with predefined resolution of (256×256×3). In order to increase the sample of training data, we used data augmentation techniques, including random horizontal and vertical flipping and random rotations having a result of 27,293 labeled images. The patches are intentionally overlapped until half of the subdivision resolution – because some trees may have been split and will not be recognized correctly

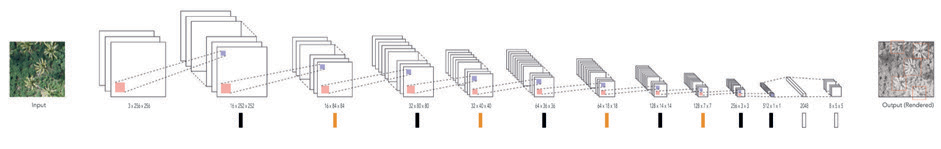
The architecture of CNN is based on a modified YOLO model. As introduced by Redmon et al., YOLO works with a prediction grid, and each cell of the grid is responsible for recognizing one object. Objects are predicted as one or more bounding boxes with a confidence value and a one-hot vector that represents the type of the object; in this ex-periment, the species of the trees.

YOLO
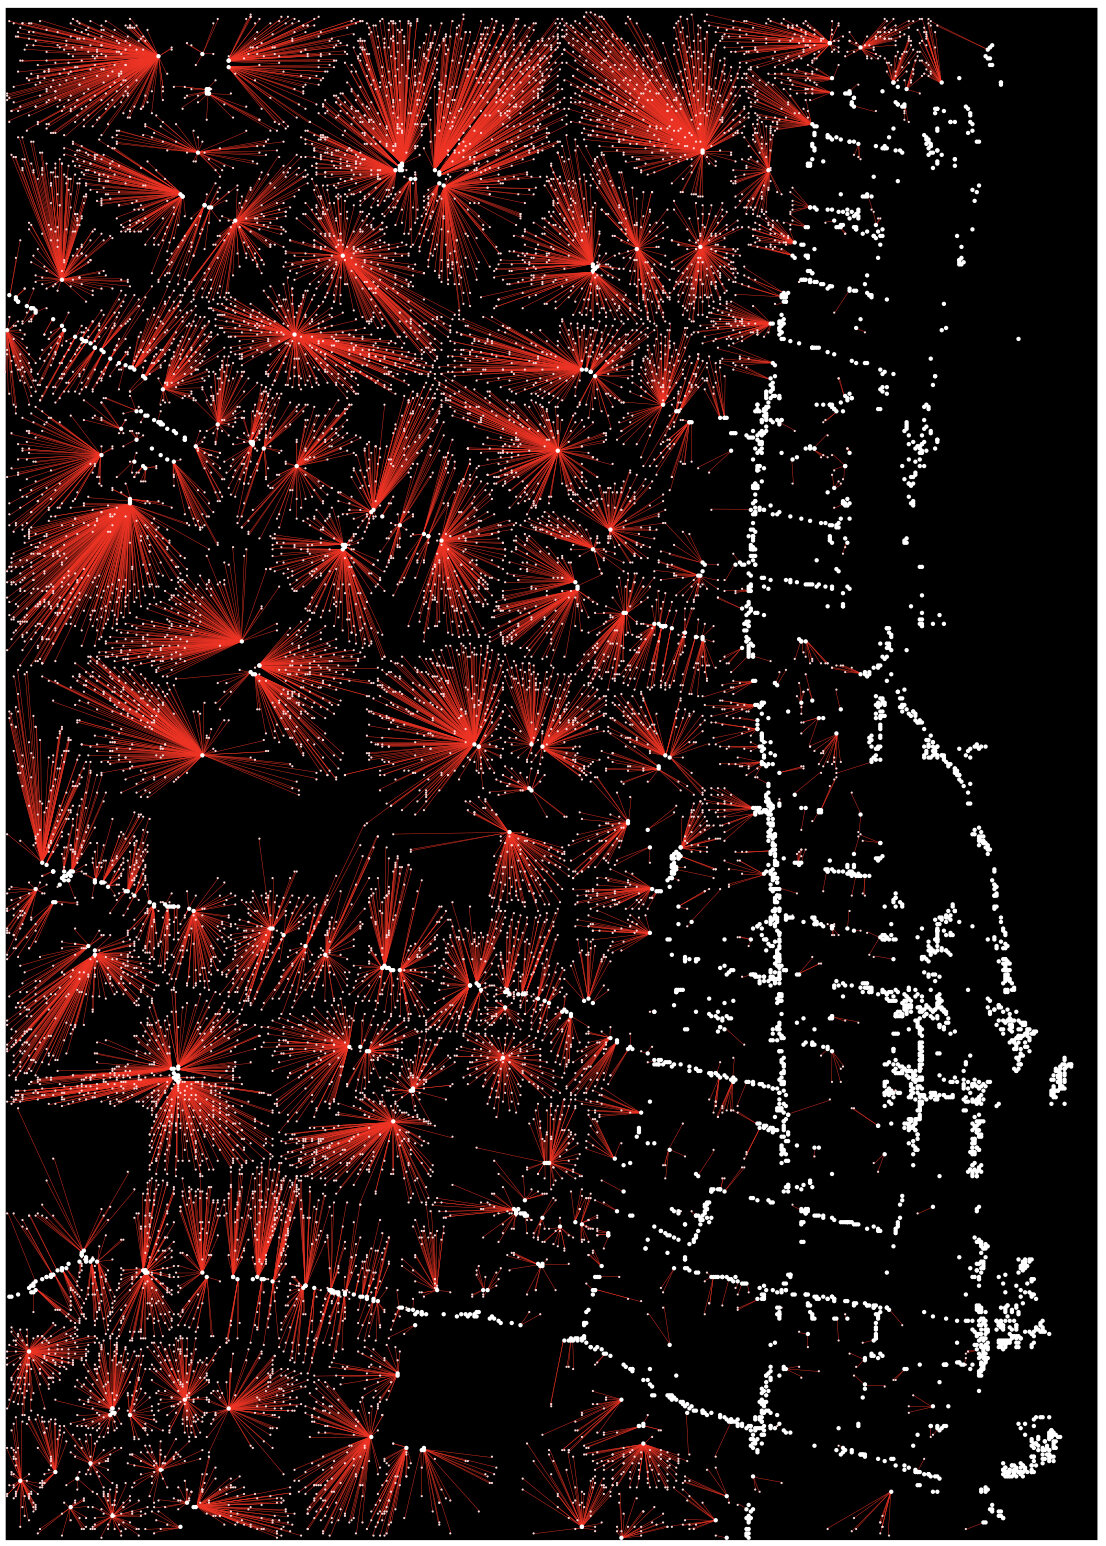
Density maps can provide valuable insight into natural scenarios such as agriculture because they can communicate the characteristics of geo-data, e.g., the concentration of trees in space. In order to determine the density of the detected trees, we map their locations back into their geo-coordinates. We rendered these results as Density Maps for each species, and later an additional one for all species. Out of 12,945 true positive trees located, 10,136 trees were coconut trees, representing 78% of the detected trees, 2340 bananas trees, 55 papaya trees, and 173 Mango trees.

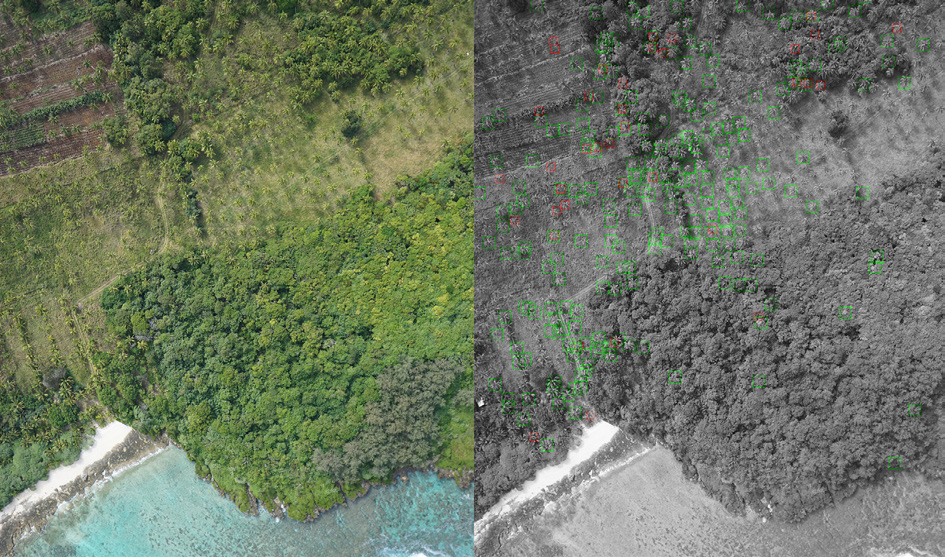
Tree Localization and Classification

Density Maps
The street detection utilizes the method of pixel-wise semantic segmentation to extract the streets out of the original aerial imagery. The semantic segmentation is a process that takes an RGB image as the input and produces an equal-size image that is pixel-wised colored based on semantic labels as the output. All the pixels that have the same label are colored identically. We highlight that unlike the tree localization and classification training data, the patches for the street recognition have no overlap. After all, patches are processed, outputs are assembled. From this output, we extracted only the street layer and highlighted it on a black and white image.
The segmentation model is based on a modified SegNet model (Badrinarayanan et al., 2015) with the input size of 256 × 256 × 3; Instead of trying to extract precise lines that represent the street network from the image, an alternative method is proposed. With the hypothesis that the probability of two disconnected street segments is one street depending on their distance in-between, we determine that the shorter the distance, the higher the probability of belonging to the same street. A random subsampling process is made on the resulting image, where each pixel labeled as a street has a certain probability of being a node and is taken into account in the next stage of the process. Then a Delaunay triangulation is made on the scattered points, re-presenting the whole street network.
The detection results are irregular and for some streets dis-connected; the leading causes of are: first, the original image may be affected by the distortion caused by the merging of many UAV-images into one, secondly, the street may be covered by tree crowns and other objects, which makes it difficult to keep consistency; besides to the instability of the detection model.

SIGNET

Weighted nodes by number of reachable trees
By overlapping the density map and the street network, the nodes of the network can be weighted by the number of trees they reach; as seen in Fig. 8. The overlapping between localization data and segmentation data allows us making queries about the network. For instance, we could ask the optimal path to harvest as many crops as possible within 10 min of traveling or vice versa. The starting point, ending point, number of trees and time of the query are user-specified, and the search process is based on optimization algorithms.
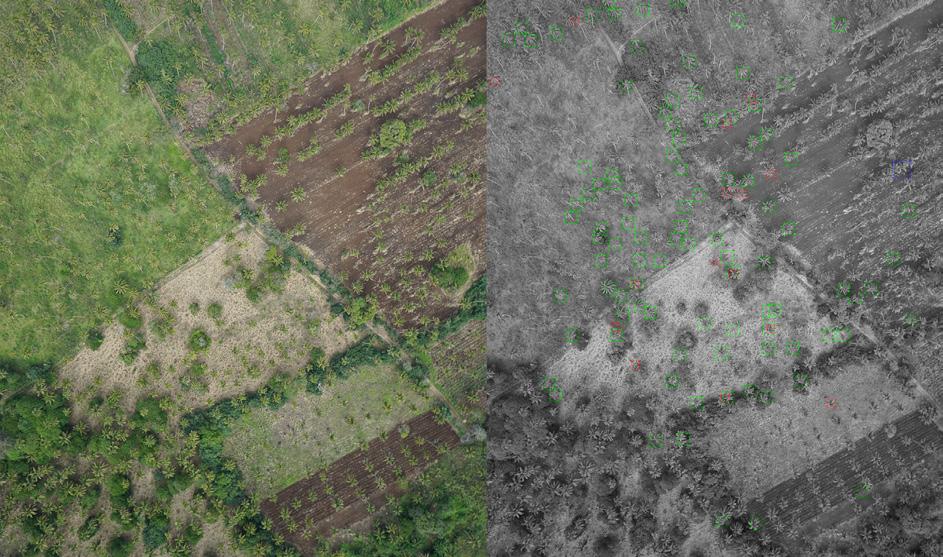
The images below illustrates the localization results. All trees are localized with a bounding box representing the class they belong to; green: coconut, red: banana, blue: mango, and yellow: papaya.

Dos Santos et al. (2017) demonstrated that the estimation of trees density is an essential first step toward large-scale monitoring. Besides this, it provides a broad view of resource distribution that enables the identification of areas with higher, mid and low densities. These results can yield actions to planning, harvesting, and management of these tropical fruits by the interests of landowners, producer associations, and humanitarian organizations – The importance of improving these ac-tions is essential not only to Tonga’s industry and economy but also to the thousands of families who depend on their extraction for sub-sistence.
The second model was able to discriminate different urban classes (Fig. 12 middle): building footprints in blue, vegetation in green, open spaces in red, and road network in white. By applying a filter, we could mask the streets and see their structure. Since the training data was from an urban scenario, and the site is rural, the accuracy of the model to detect streets was low. For example, some parts of the buildings were mistakenly labeled as streets. Therefore, these results required further post-processing as described in the subchapter Path Optimization.

Sematic Segmentation
Resampling and graph-making processes provide a systematic ap-proach to overcome this issue. The precise extraction of the street can be bypassed, making it possible to use these results in applications like pathfinding and path recommendation. The two proposed tasks for pathfinding show that this bypassing is possible and useful. Some path query results are illustrated below.

Gallery