
QUANTUM RAILS
Encoding with AI the change in the built environment after a Natural disaster
In collaboration with Diana Alvarez Marina, Guo Zifeng and Bjoern Thorsteinsen
Networks occupancy and saturation are a deep Spatio-tem-poral problems. Every single site of a network is redefined anew when observed under a different time frame. By considering space and time simultaneously, the taxation of resources can be intelligently reduced. In other words, a particular segment’s capacity varies not only throughout the day but also in relation to its positioning within a whole network, which is itself moving, both global and local. A task of such complexity requires a great deal of machine intelligence, in as much as human intellect.
To approach this challenge, we consider various datasets representing multiple dimensions of the SBB rail network: First, A geometric dataset for space, presenting all Swiss train stations considered in this model and their respective locations and IDs. Second, a yearly timetable (www.opentransportda-ta.ch), relating these points of space in time. Relationships in this timetable allow us to calculate degrees of occupancy with hourly precision. This dataset was fundamental to our chosen strategy. Finally, the planned maintenance sites will be compared and studied concerning our designed and obtained “Index of Occupancy,” as a contextual index for Spatio-temporal occupancy of operating segments.

We worked with spatial and temporal data, such as the rail network and the yearly timetable. We considered construction sites are spatiotemporal data, where space is a given and time is unknown. In this project we performed the following:
1. We created a topology of the Swiss network.
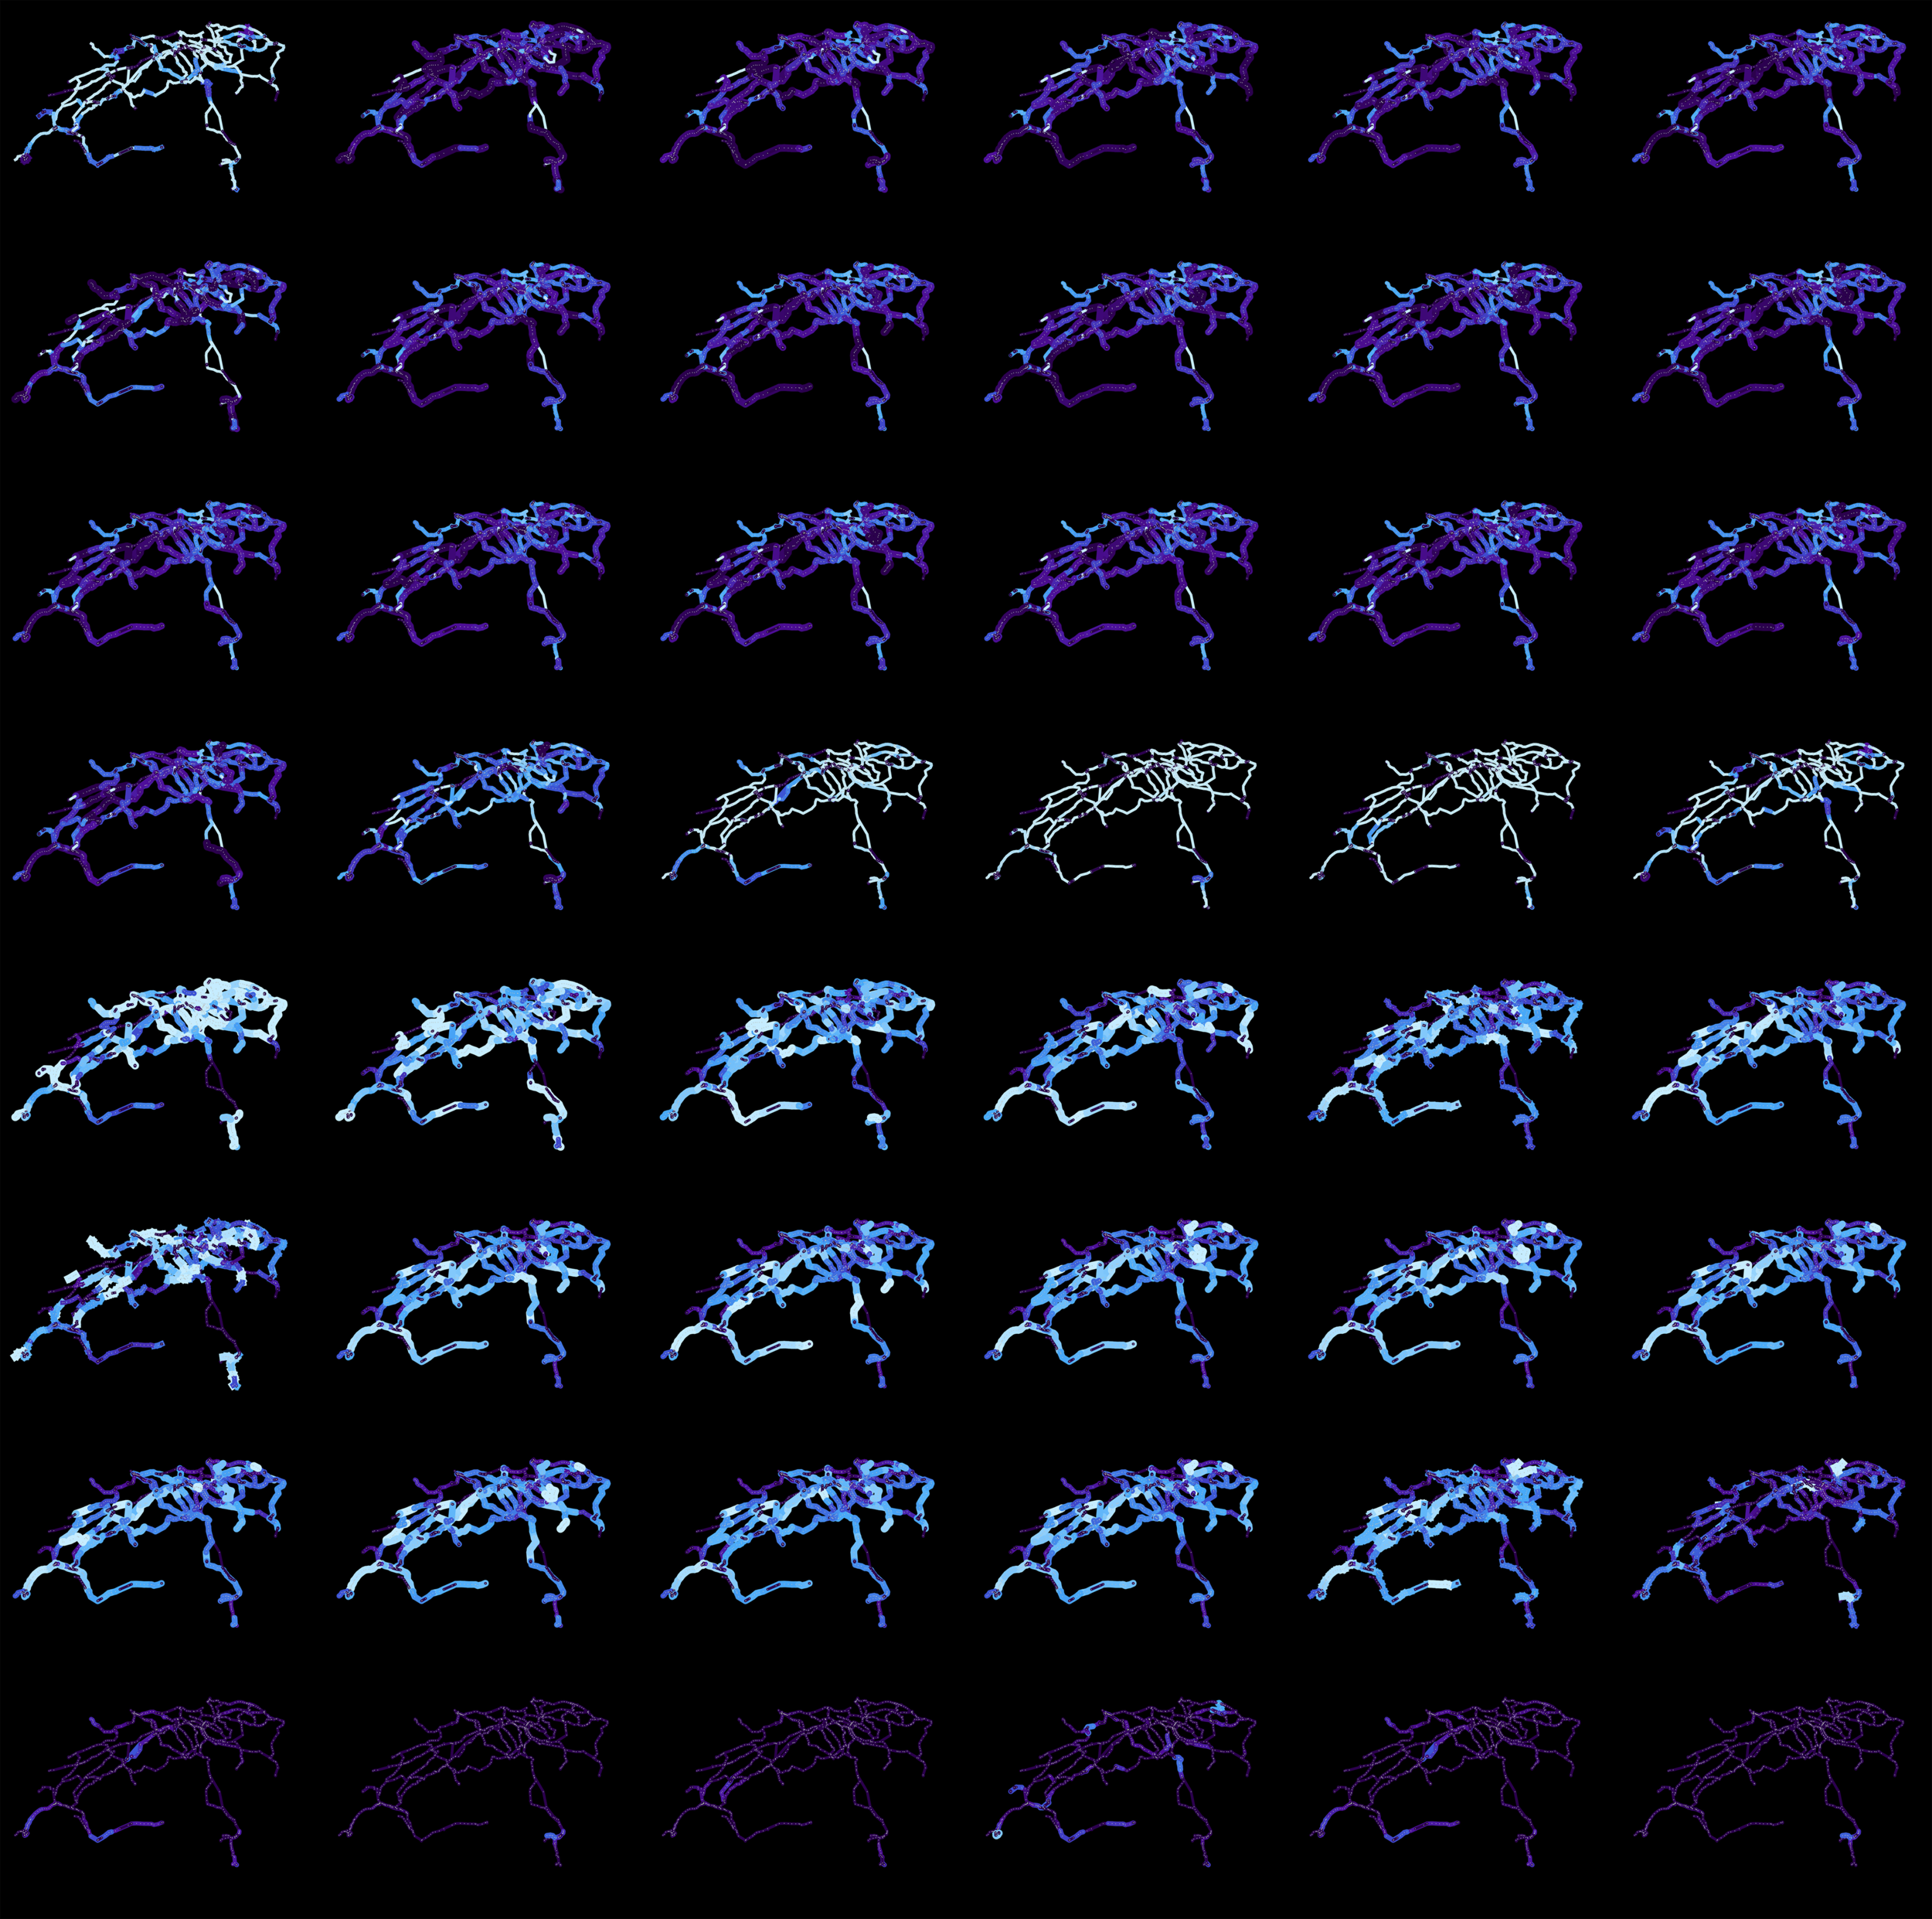
2. This topology is loaded with trains frequency in time. We created 24 graphs as sections in time for “Weekdays,” “Saturdays and “Sundays.” Each graph allows for creating a dimension for an operating section as edge weight.
3. Each 24-dimensional section is reduced to one dimension or “index of occupancy.” Rather than referring to a specific hour of the day, this index relates to traffic’s overall behavior.
4. We project these indexes back to space as a heat map. An index allows us to find similar operating sections, like a Google for traffic.
5. Planned construction sites are projected on this heat map, where possible bottlenecks are identified.
6. A selected index of occupancy provides a recommended hourly allowance to minimize restrictions and maximize capacity.
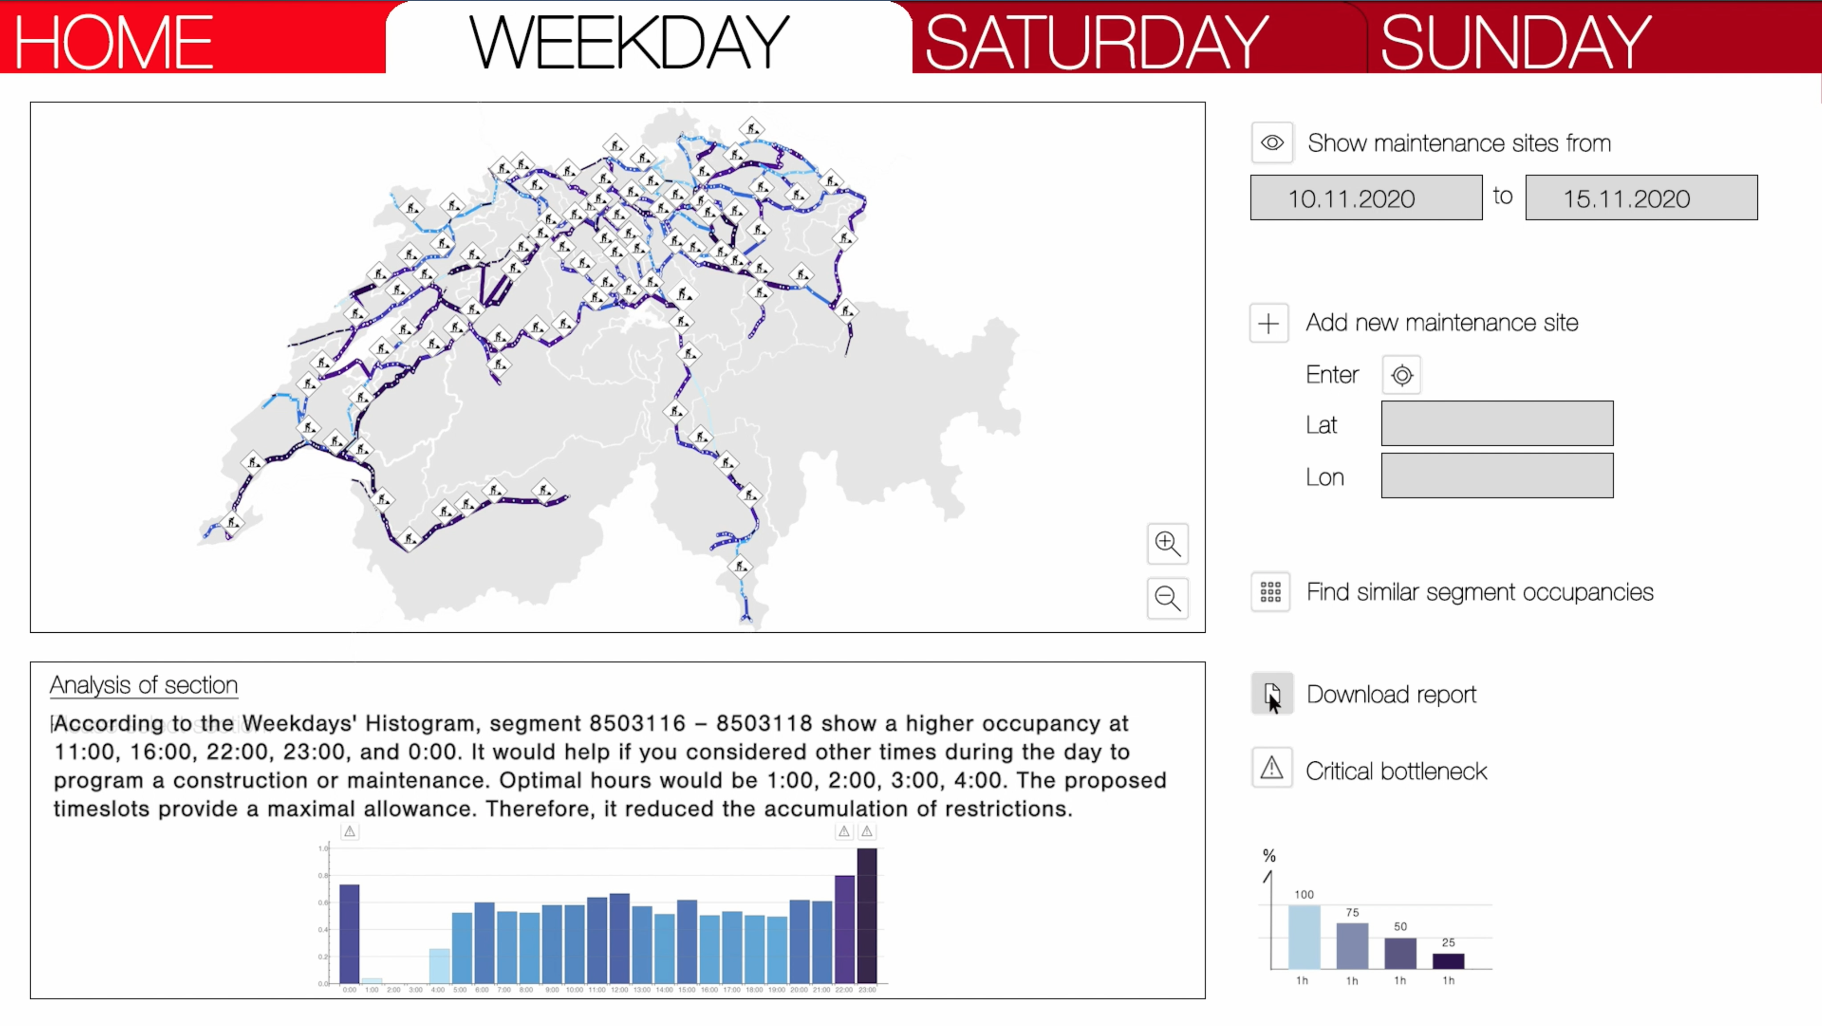
7. QUANTUM RAILS is presented as an interactive “single client view window” allowing detection, recommended planning, and reporting.

PROPOSED INTERPHASE
The interphase has the following features:
- Display of maintenance sites
- Addition of new maintenance sites
- Display sections with similar traffic behaviours.
- Critical bottlenecks highlight
- Ratio of occupancy and Improved restriction allowance recommendations
- Download and print the report.


Gallery