
CITY OF INDEXES
Articulating Personal Models of Urban Preference with Geotagged Data
In collaboration with Diana Alvarez-Marin
How does one assess the potential of liking a city or a neighborhood before ever having been there? The concept of urban quality has until now pertained to global city ranking, where cities are evaluated under a grid of given parameters, or either to empirical and sociological approaches, often constrained by the amount of available information.
Using state-of-the-art machine learning techniques and thousands of geotagged satellite and perspective images from diverse urban cultures, this research characterizes personal preference in urban spaces and predicts a spectrum of unknown likable places for a specific observer. Unlike most urban perception studies, our intention is not by any means to provide an objective measure of urban quality, but rather to portray personal views of the city or “Cities of Indexes.”
This experiment started with data collection by crawling two representations of the city, Google maps, and eye-level, Google street view. GoogleMaps images were vectorized using a Convolutional Neural Net (CNN) for feature extractor, then clustered with Self Organizing Maps (SOM), to later map them back into space, generating a pixel-map showing each city’s structure. The google street views were presented to a user to rate an urban space by personal preference. This rating was treated as training data for the next CNN to learn the patterns of preferred places.
The present experiment has been not only an exploration of dealing with urban data streams but also a vivid example of communication between seemingly incomparable entities such as cities from different urban cultures. A selection of 20 cities was not fortuitous but was the articulating of the idea of globality within this experiment, which we treat as a generic ground or global frame of reference. This reference was not absolute but open to discussion based on a specific interest. These pieces of cities, at first mute and unable to “speak”, once symbolized through an informational face started “talking” self-referentially. Rather than just witnessing this generic play, we projected preferences on it and started “talking” to them. By doing so, creating local meanings, memories of unknown cities, affinities, preferences, personalized Cities of Indexes.
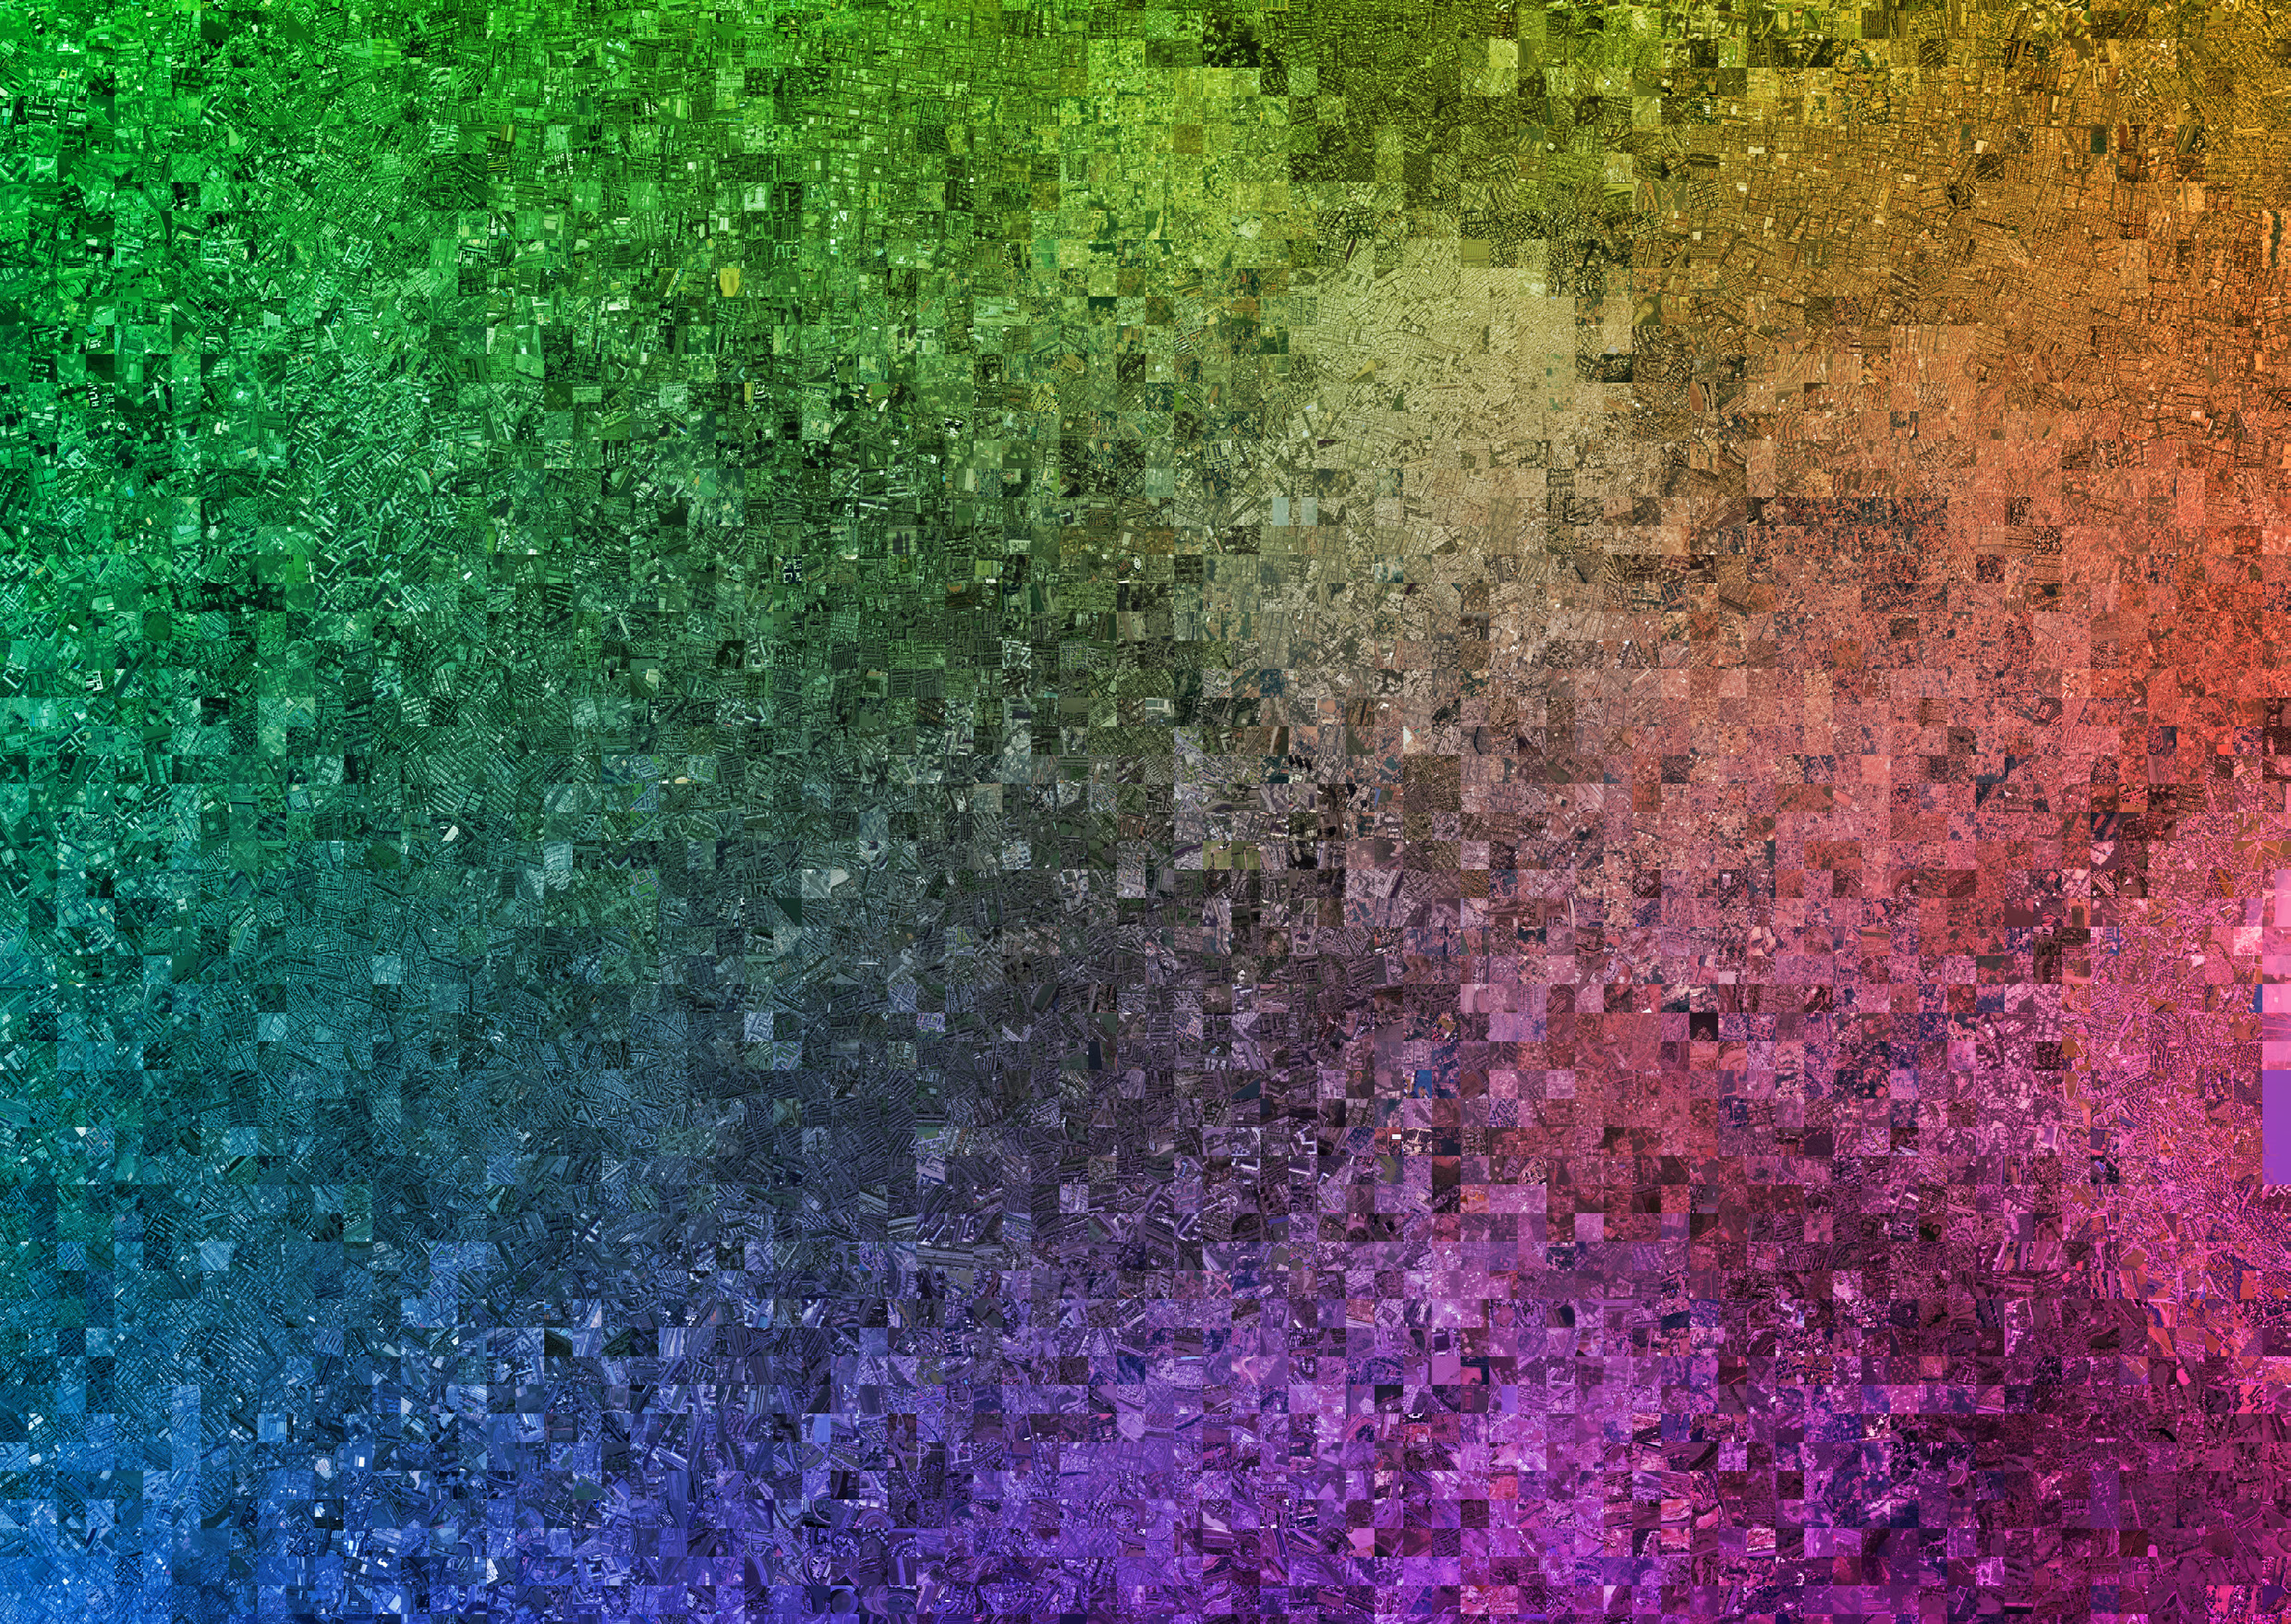
The initial dataset of pictures is now a list of 50,000 vectors of 4096 dimensions each. Such a high dimensionality needs to be reduced so that Human Intelligence can make an interpretation out of it. After operating and computing on a high dimensional level, vectors can be reduced to a two-dimensional space using the dimensionality reduction algorithm t-SNE. This is how n-dimensional vectors, meaningless to humans, can be transferred again to a lower dimension, where a stimulating arrangement of spatialities can be opened up for personal interpretation

Clustering of data
To adequately explore relationships in the data arrangement can be unfolded into a continuous two-dimensional map or landscape of similarities by using the unsupervised machine learning algorithm Self Organizing Map (SOM)5 (Kohonen, 1982), where each image positions itself based on its similarity to its neighboring images. The SOM is initialized with an 80x80 cells matrix and fed with an input of 50,000 two-dimensional vectors, obtained in the previous step. The training procedure involves one million epochs until the response layer evolves into a stable configuration.
The resulting spectrum spans over 6,400 cells or Best Matching Units (BMU’s) that can be considered as characters inside an alphabet, where each character impersonates a certain spatial quality without needing to refer to a specific position in space.

The Indexes of Google Earth

The Indexes of Google Street View
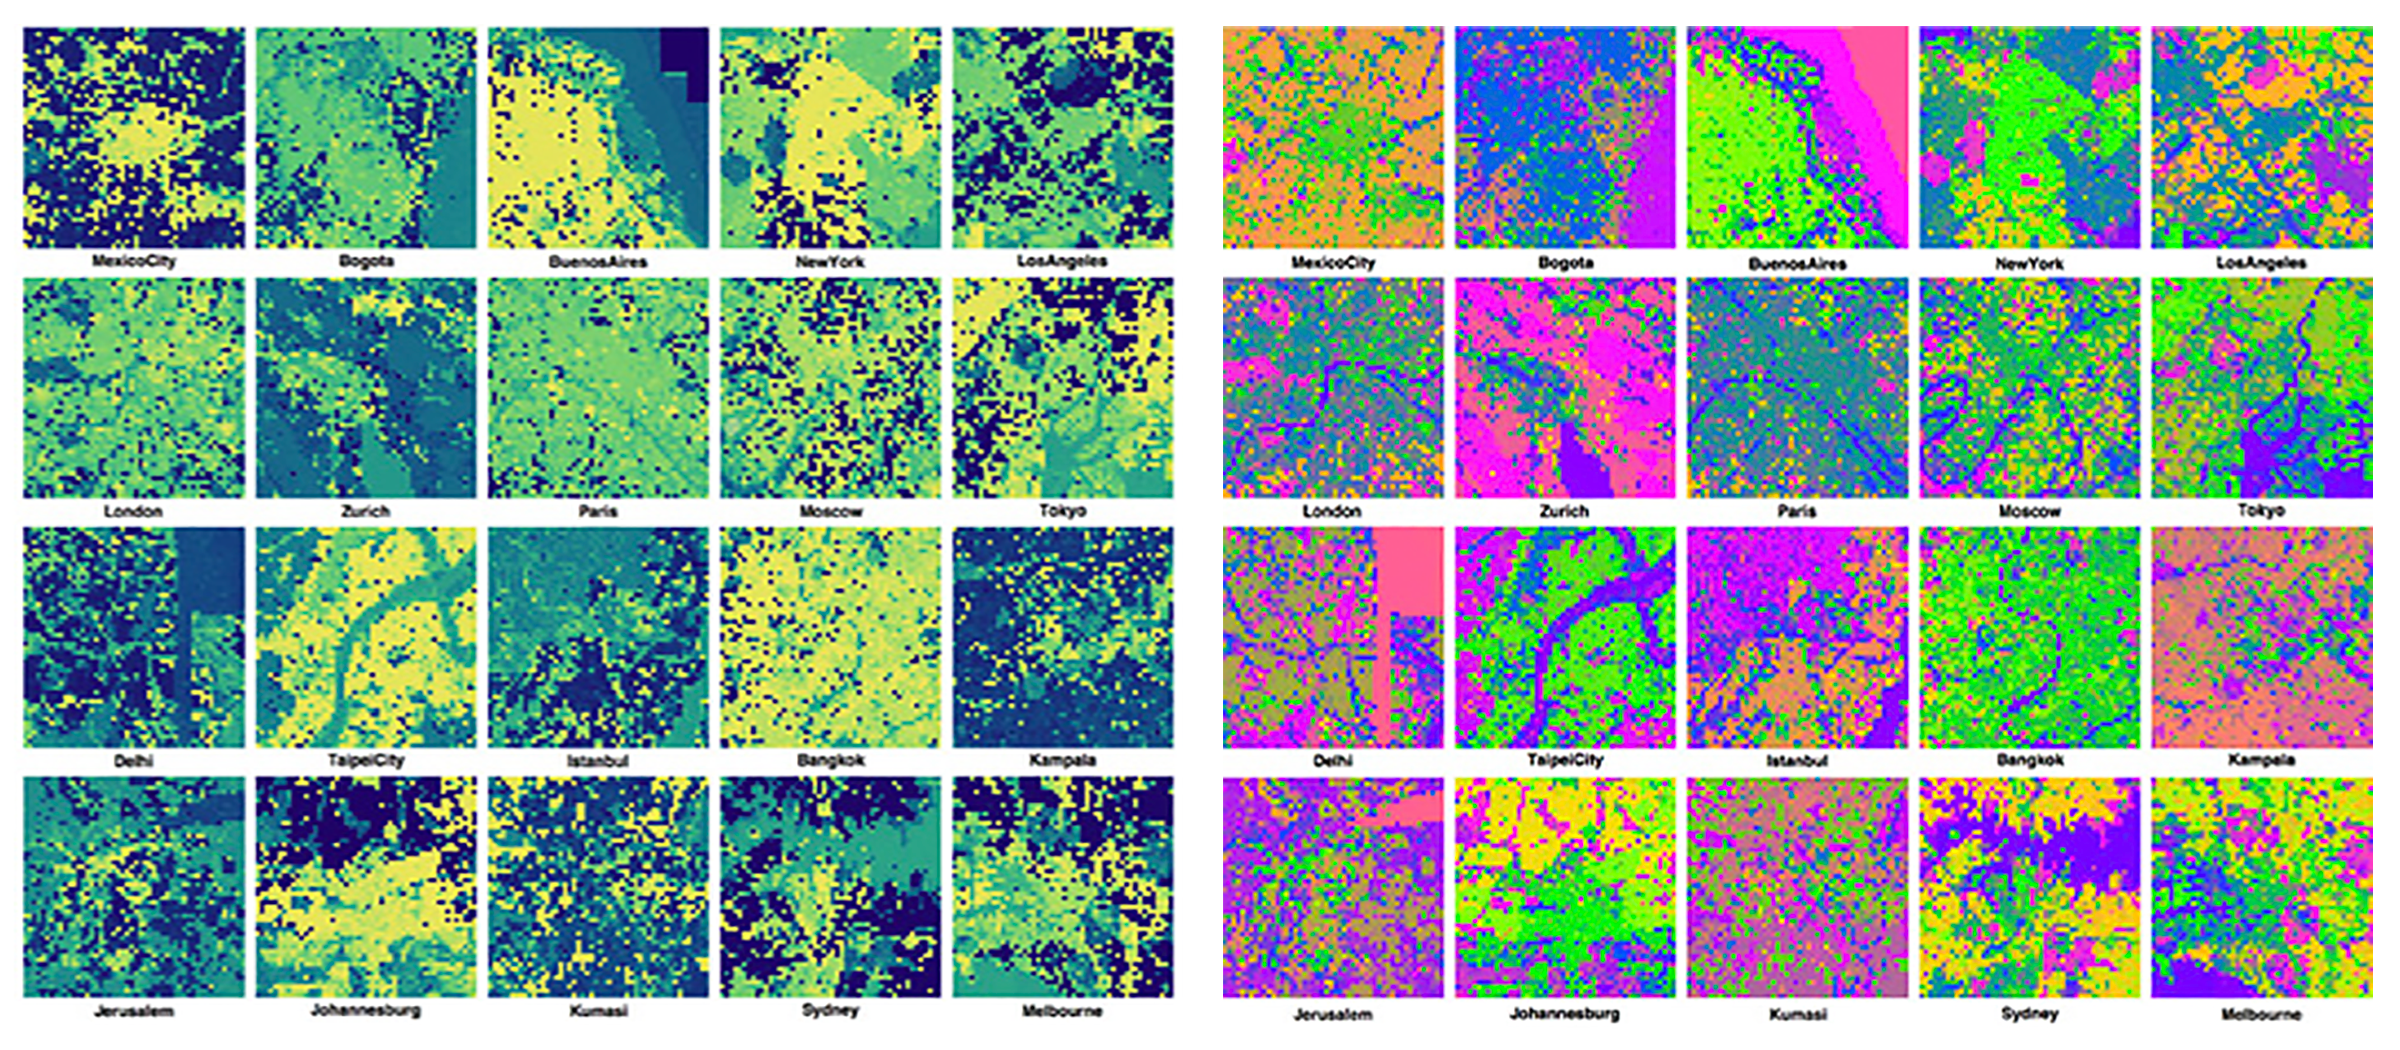
The implementation of Machine Learning Algorithms in remote sensing and land use classification is still recent, and state-of-the-art approaches tend to define a specific number of classes to represent a particular city. Unlike state-of-the-art, for this experiment, specific labeling is avoided, so that the whole spectral alphabet of 6,400 characters can be preserved. With this in mind, a grouping of several characters could correspond to words that can describe a city as text. For this purpose, rather than labeling, a color spectrum or non-semantic labels can be assigned to such characters. Characters can be traced back to a position in space if desired so that recovering their spatial order they can be seen as a specific texture of colored pixels or spatialities constituting a city fabric.
Pixel of Taste and Structure
The K-means clustering algorithm is fed with the weight vectors of the 6,400 BMUs resulting from the trained SOM. A maximum number of clusters out of this map is obtained, resulting in 513 cases out of which each centroid becomes a representative element or a condensed way of conveying information . The Vesanto et al. (2000) SOM Toolbox for Matlab proved that this process performs better than a direct clustering of the totality of the dataset (32,000 street view images) and reduces computation time. With this approach, a compact, representative, and reliable training dataset of 513 images can be efficiently labelled by Odysseus without losing consistency.

The Process of Gathering the Training Data
In the following images, Odysseus’ pattern of preference are depicted as a way to confirm its overall consistency. Even if cities are different and unique at the same time, Odysseus may be able to find a similar experience of his preference in a multiplicity of places from different urban cultures. He might like cities over extended areas, like in Johannesburg, Tokyo, Melbourne, and Mexico City, with radical transitions across a boundary that may be given by the presence of large natural elements such as the sea or a specific topography. On the other hand, he may think of other cities as melting progressively into their surrounding landscape, likable all over with some punctual dislikeable places, as it can be seen in cities like Zürich and Istanbul.
Inversely, in other cities, namely the ones with an imperial past such as London, Paris and Moscow,he may dislike nearly everything except punctually distributed meaningful places that might refer to monuments or historical landmarks. Other cities, with a higher degree of disorder, such as Kumasi and Delhi, may be likeable as much as dislikeable in a more or less similarly well distributed.


During this experiment, the impossibility of physically perceiving and assessing an unknown place was addressed by predicting the likability of any place in any city on Earth. This obstacle was dealt with by considering such places in an indexical manner, encapsulating different possible representations of places such satellite images and street views simultaneously. Each one of these representations could be symbolized as numerical vectors to be computed with dimensionality reduction clustering algorithms. This research developed two kinds of spatial alphabets: a generic one, corresponding to the clustering of images based on spatial structure (Feature Extraction of an image and its corresponding contextual numbers) and a specific one, corresponding to the personal projection of preference on these images (Classifier output as probability distribution and its corresponding contextual numbers).At the current stage of this research, the resulting application should be seen as a prototype that was only trained with the preferences of the authors, under the fictional character Odysseus. Future steps in this research would direct towards opening up this pipeline to any user who would like train a personal model and identify patterns of personal preferences in urban spaces.
Gallery