CATALOG OF CHANGE AFTER NATURAL DISASTERS
Encoding with AI the change in the built environment after a Natural Disaster
In collaboration with Sebastian Almagro
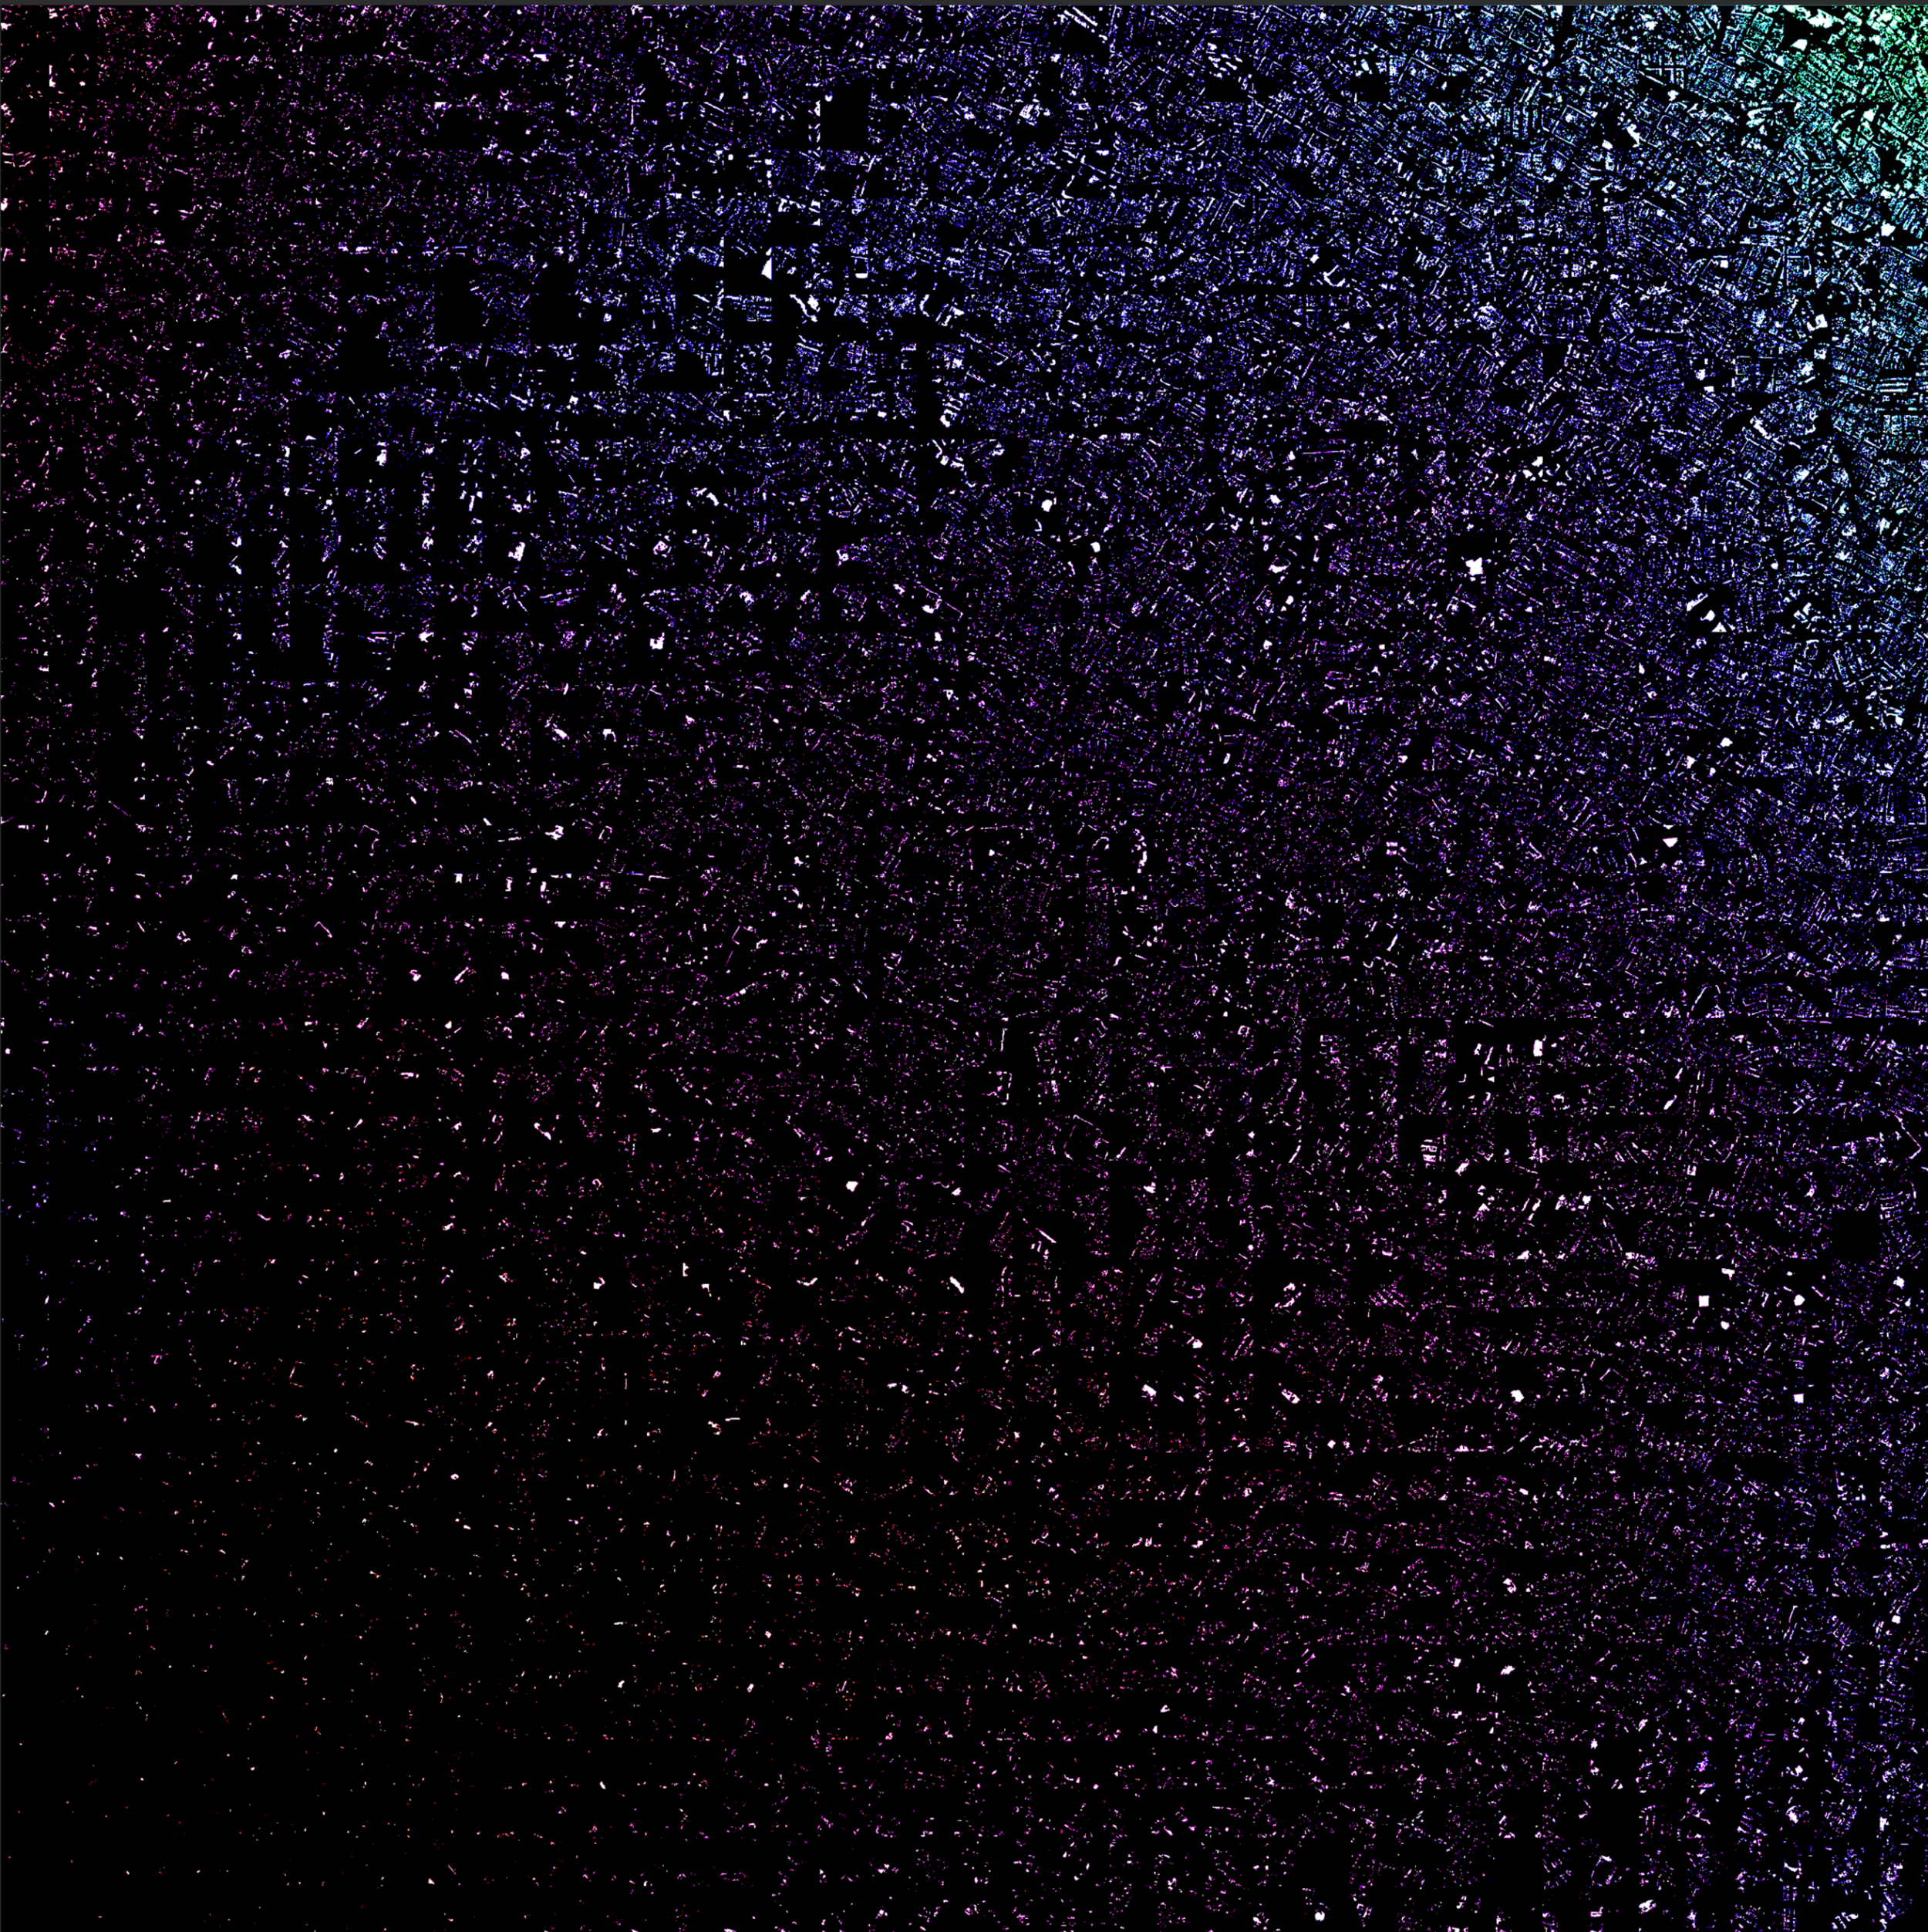
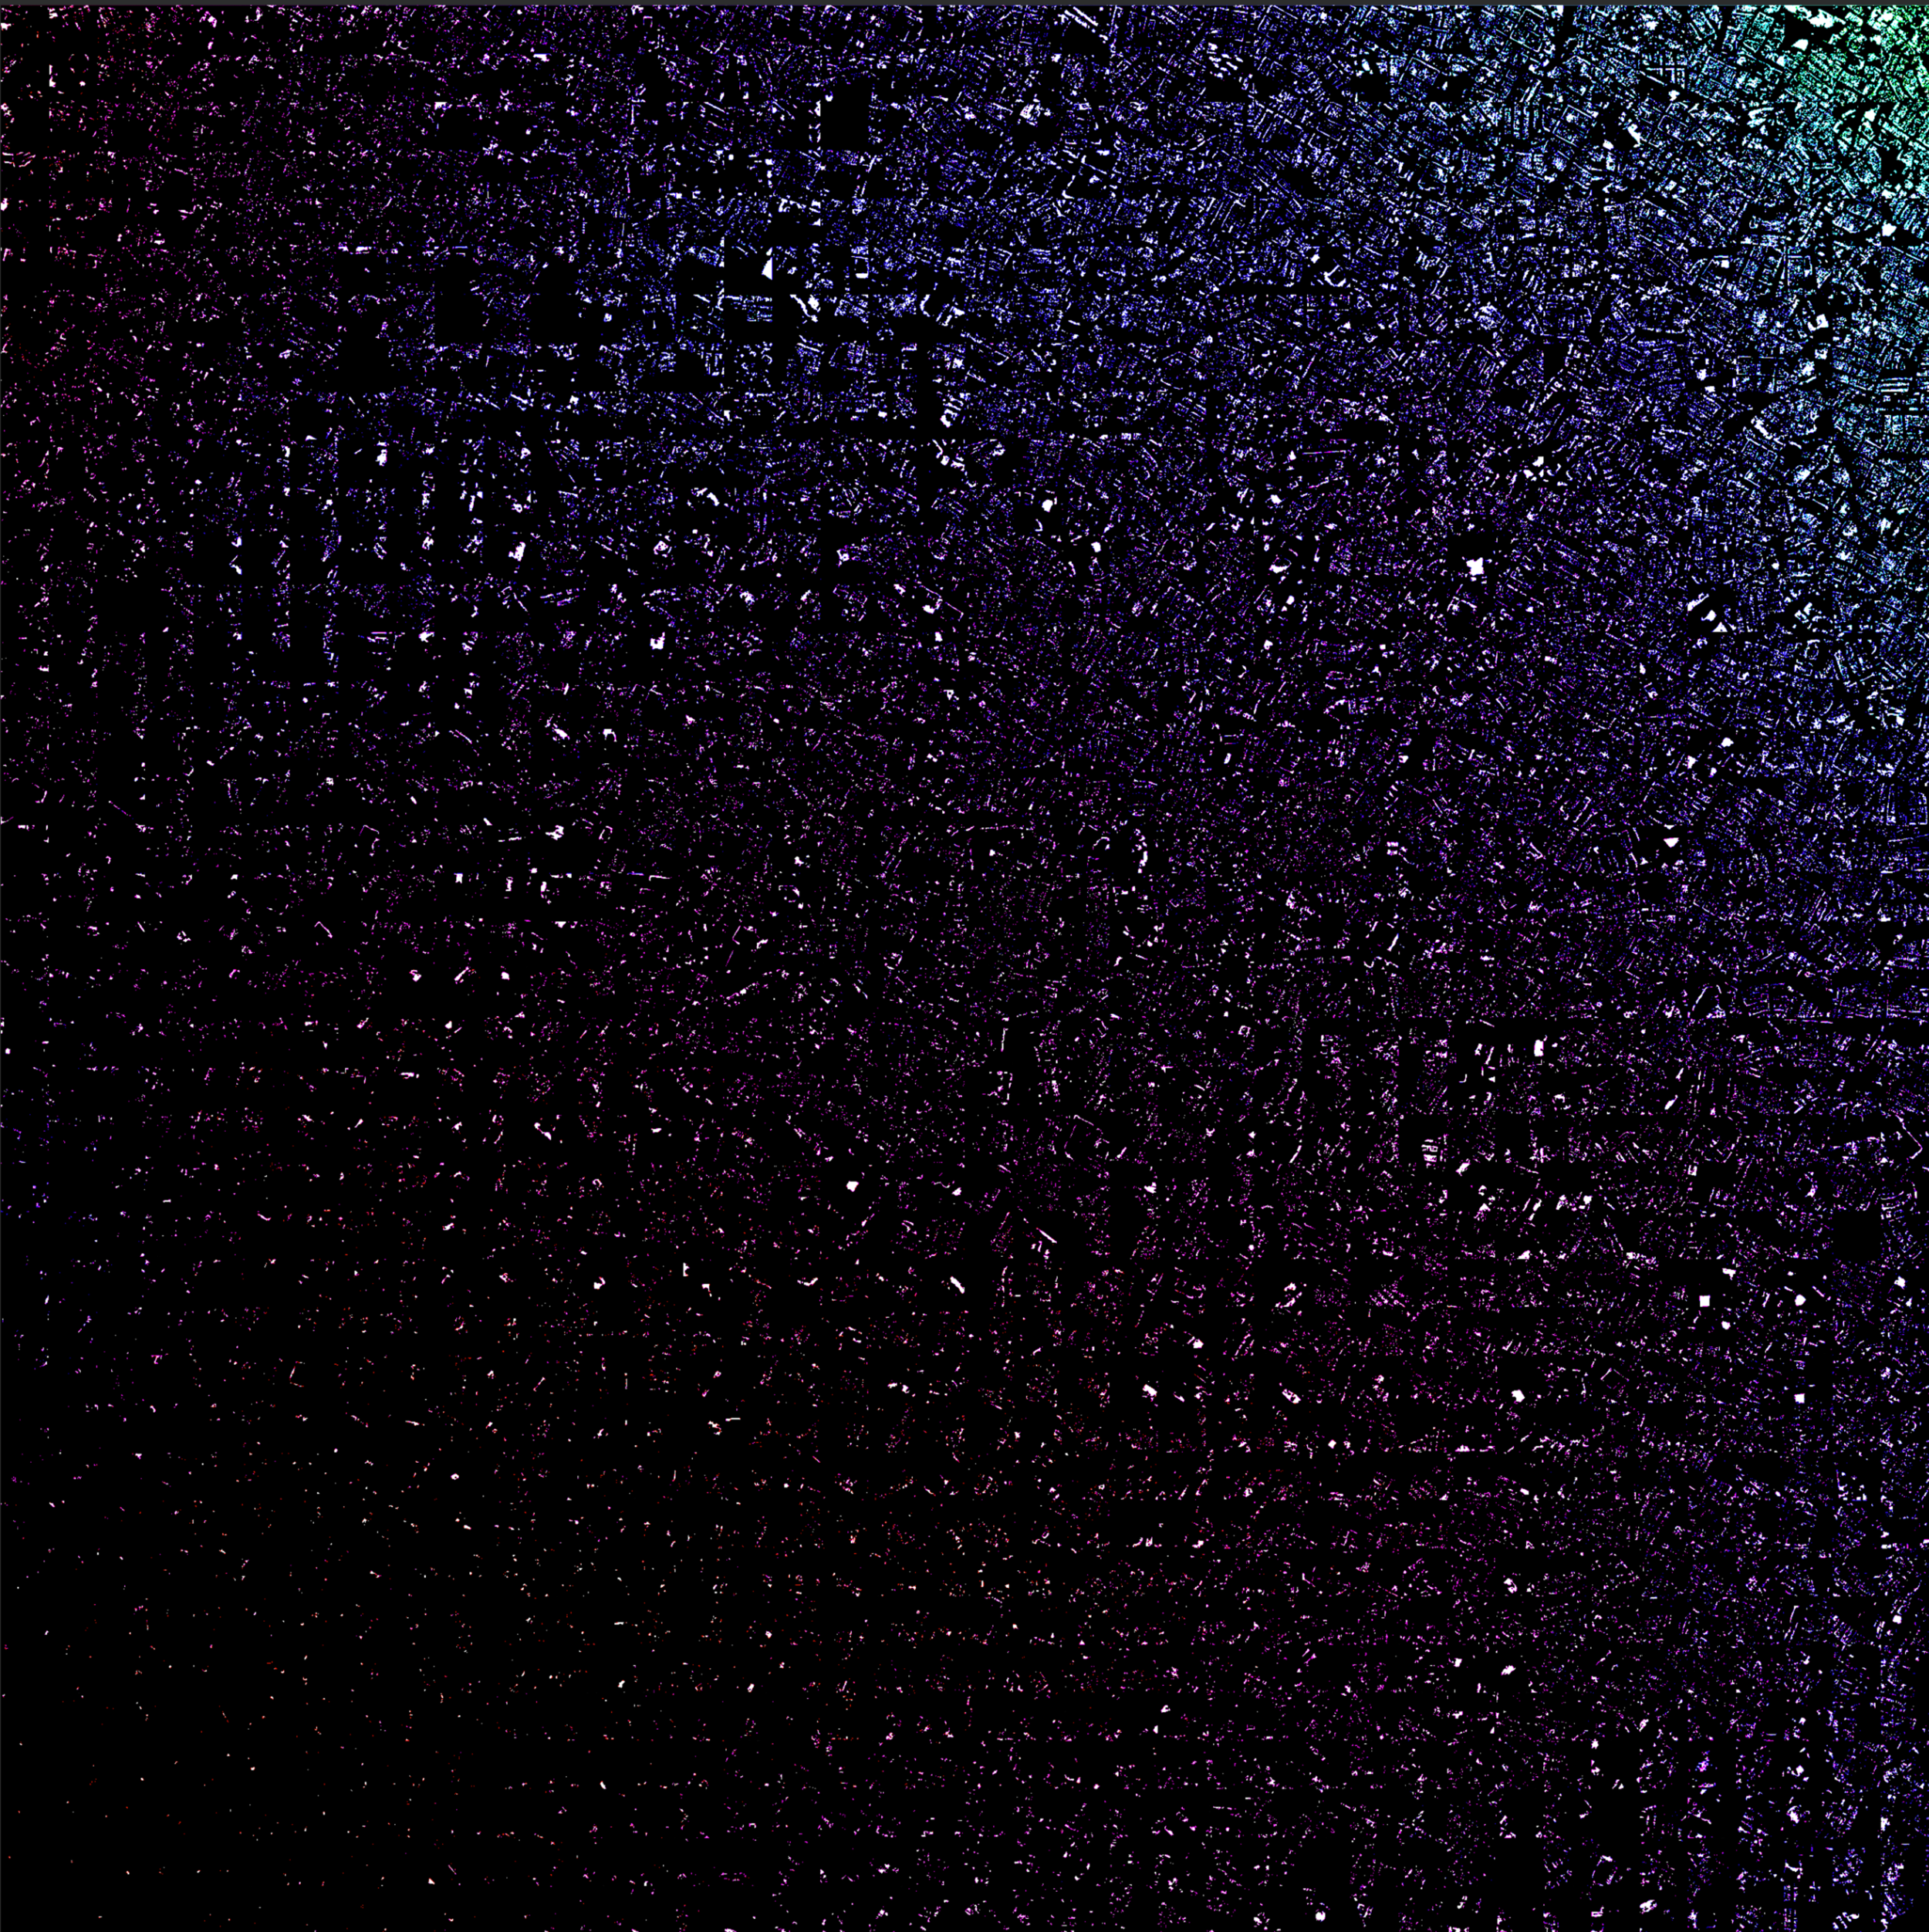
The experiment attempts to encode the change that occurred after a natural disaster. The data used are aerial images of before and after a natural disaster. With the help of a crawler, 50,000 aerial photos of 500 natural disaster epicenters were collected. The experiment continues to use a Convolutional Neural Network algorithm that performs the Semantic Segmentation task to segment the built environment of both states and then compare the changes before and after the disaster event. The comparison was transformed into numerical data from similar patterns found in change detection and statistical data on the disaster itself. These numerical entries were entered into a self-organizing two-dimensional map (SOM) that organizes all coded changes in the data set. The created SOM will code each data point in terms of all the data; therefore, encoding the change for any satellite image. By grouping these data, a catalog of changes can be created to serve as a predictor for future cases. The catalog allows for predicting possible changes in a new case study’s built environment to immediately initiate an architectural planning process to mitigate their impact.

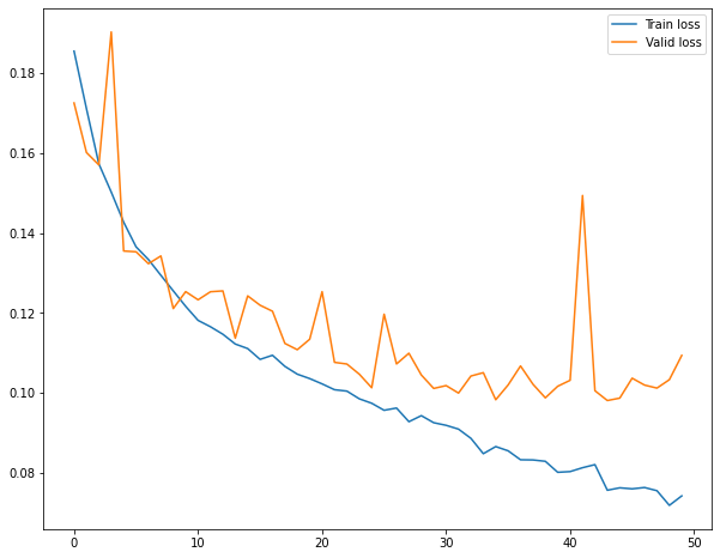
We identified the buildings using an AI pixel-based semantic segmentation method with 92% accuracy in segmentation. After the segmentation, the building layer was extracted as a black and white image of both states, which permitted to calculate the difference between them, which became a coefficient of change.
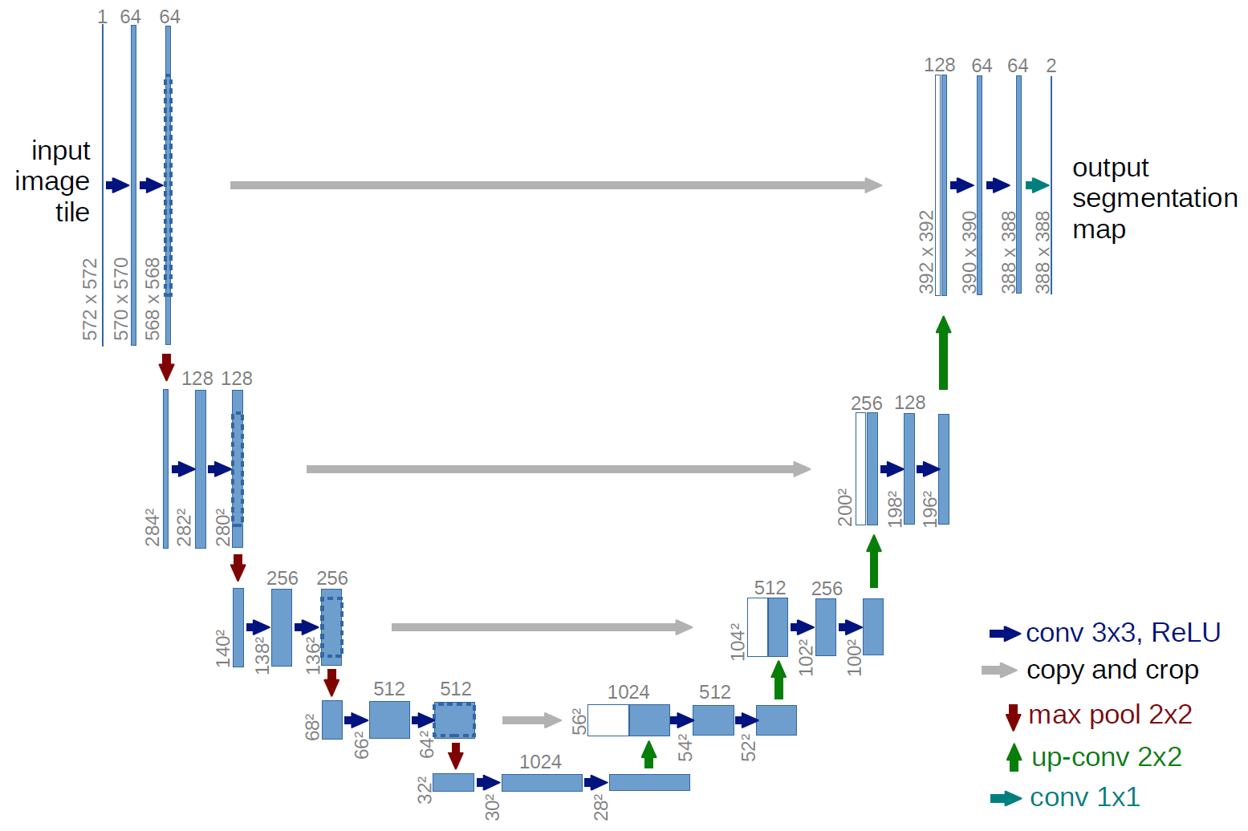


We utilized a famous image segmentation network architecture,U-Net. [image source: U-Net: Convolutional Networks for Biomedical Image Segmentation.] The initial use for this architecture was for medical analysis, it has been proved to be suitable for different image segmentation tasks.
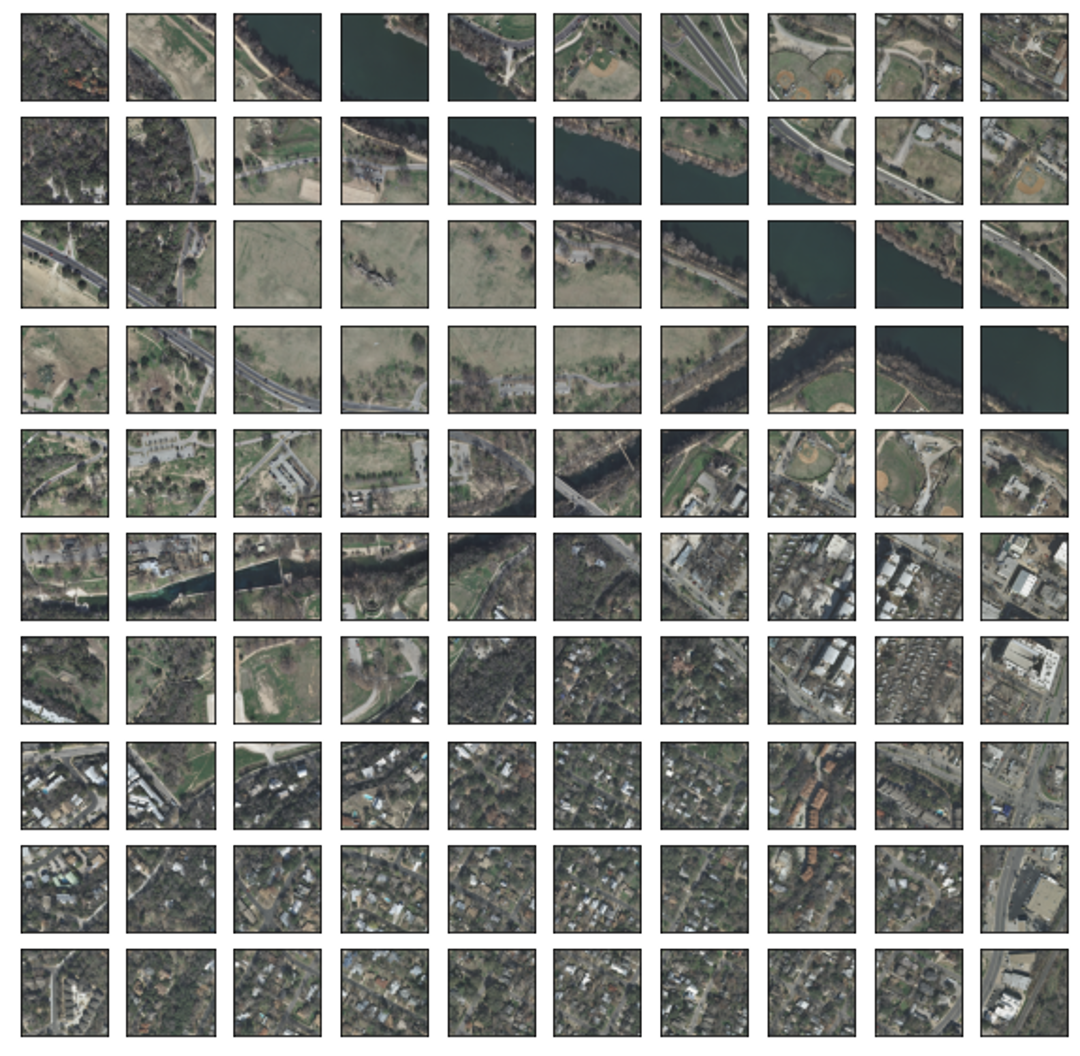

The images provided for training the model were divided into patches to speed up the process. The correct selection of the size of these patches can drastically influence the prediction of the model. We will seek to train the NN with cities with similar characteristics to those with natural disasters for the following model iterations. Since a model trained with labeled images from developed countries might not be deployed/applied in developing countries.

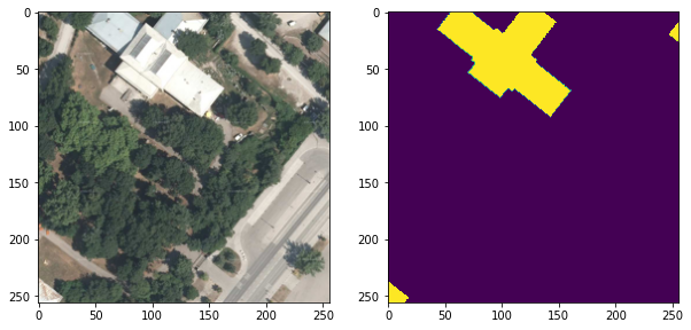


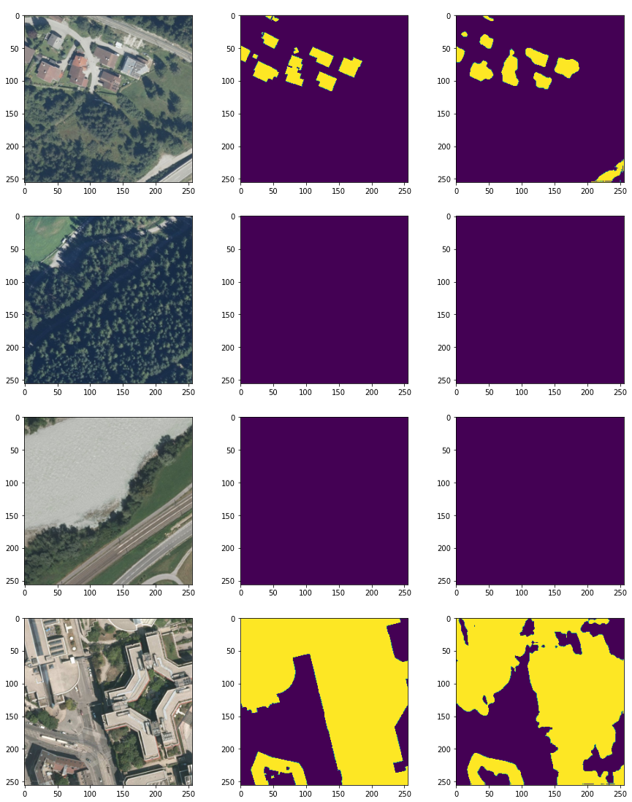

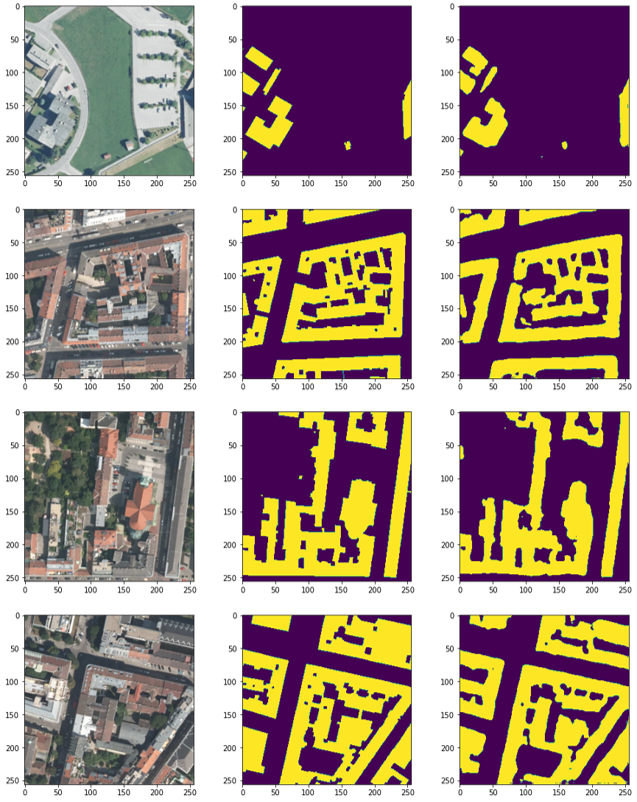
The predictions of one of the first versions of the model trained to identify buildings in satellite images.

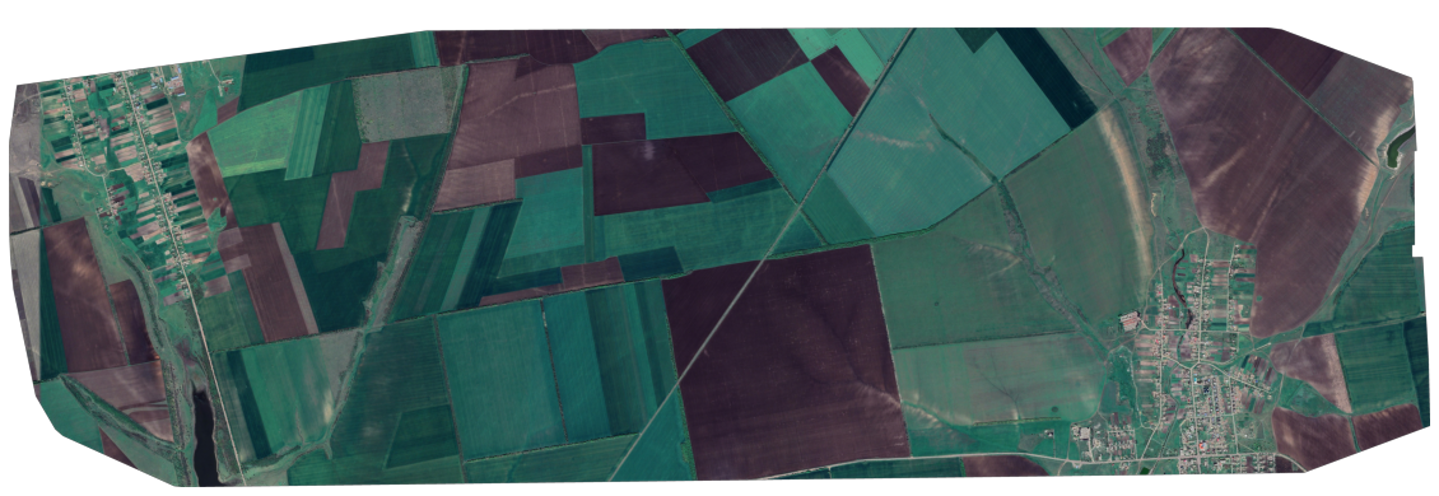
The satellite images of natural disasters have been merged using orthophotogrametry techniques. A double prediction of overlapping areas is avoided by dividing the images into patches with appropriate dimensions.

Finally, the model is implemented over the areas of interest, before and after the natural disasters. In this way, the change index is calculated based on the percentage of change of the satellite images. It should be noted that this percentage of change does not consider new structures built but those affected by natural disasters.
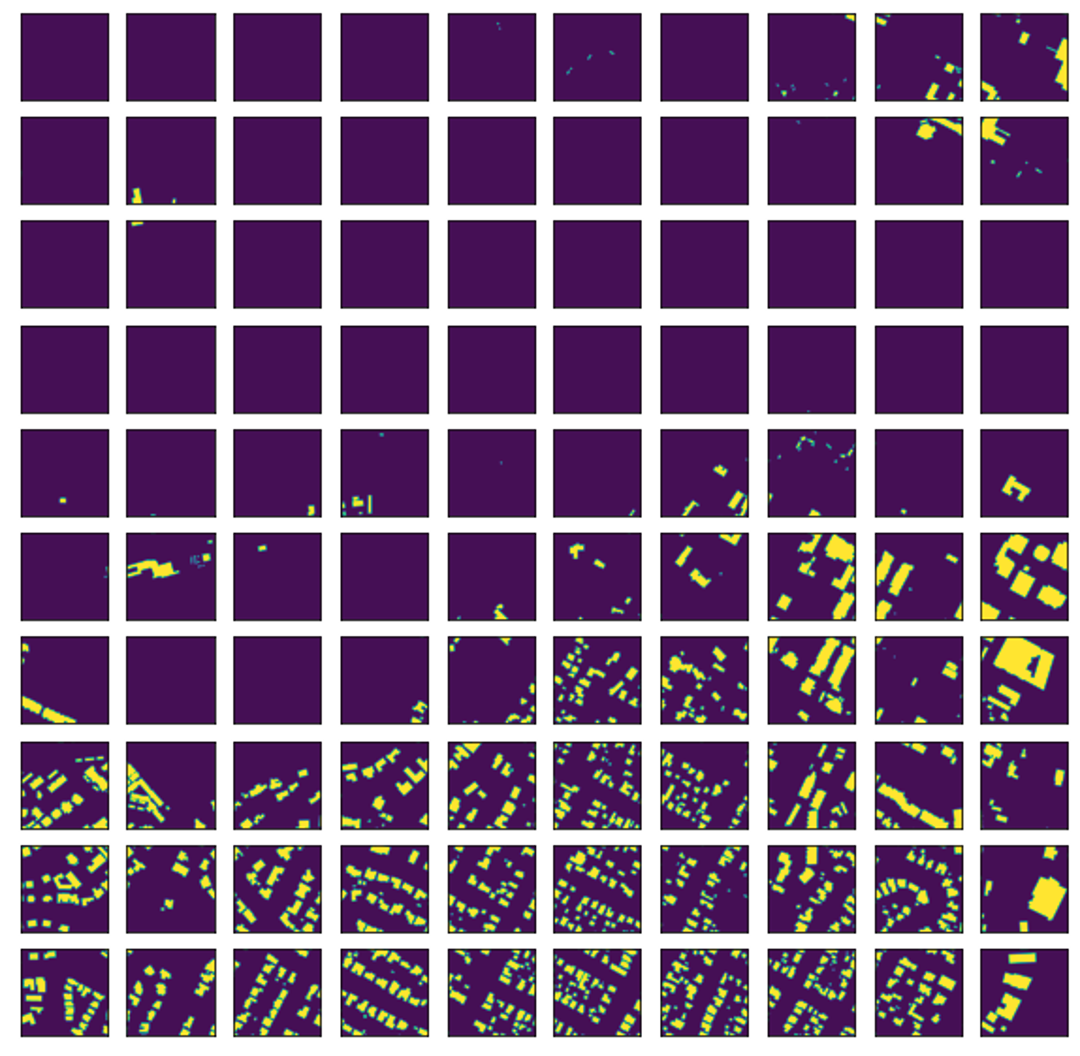
GALLERY