

Enhancing Disaster Resilience
An AI Framework for Identifying Campus Vulnerability to Flooding Based on Human Perception
In collaboration with Mobina Noorani, Chengjie Chen, and Frank Fernandez
,
This project aims to improve disaster resilience by using street and aerial built environment imagery data to automatically identify vulnerabilities in campus facilities. The study employs a dual-scale approach focused on 30 public universities along the Gulf of Mexico. At the aerial scale, satellite images and GIS maps, including flooding, density, digital elevation models (DEM), and material types, are overlaid to pinpoint flood-prone areas. Simultaneously, street-view imagery is captured from precise geographic locations corresponding to the aerial dataset. The data collection method utilizes the Open Street Map (OSM) API to extract road networks while limiting data extraction to building facades, resulting in a dataset of 675,486 images (including street view, satellite, flooding map, density map, DEM, and material types map). A web interface integrating all collected data is developed to gather qualitative feedback on flooding vulnerability at a human scale. The aerial view provides context for labeling street view images. A cluster-then-label approach is implemented to streamline labeling, incorporating an AI feature extraction algorithm (T-SNE) and an unsupervised clustering algorithm, Self Organizing Map (SOM). The web interface will be tested by professionals with expertise in campus facilities and operations, identifying vulnerability features in collected street view images. Preprocessed labeled data will be used to train a neural network classifier to predict vulnerability based on an aggregated metric characterizing how each identified element contributes to the perception of vulnerability. This project introduces a novel qualitative metric of vulnerability experience correlated with actual quantitative metrics derived from overlapping GIS maps.

Introduction
The threat that natural disasters pose to colleges and universities is exacerbated by climate change. Hurricanes Katrina and Rita caused $1.4 billion in damage to over two dozen campuses on the Gulf Coast in 2006 (Mangan, 2006). In 2017, 47 colleges and universities received $63 million in federal aid after being hit by Hurricanes Harvey, Irma, and Maria (Zamudio-Suaréz & Ellis, 2018). In 2022, Hurricane Ian impacted universities in Florida, Georgia, and North Carolina, causing significant damage to the University of Central Florida and Florida Gulf Coast University (Florida Politics,2022). This damage required a complete assessment of the buildings to ensure their safety. Racial minorities and low-income students are particularly vulnerable during disasters. They often do not return to complete their studies after evacuating or being displaced (Johnson & Rainey, 2007).
However, most research on climate change in higher education focuses on improving campus sustainability or reducing carbon footprints. This project aims to identify campuses' vulnerability to natural disasters, particularly flooding, at a qualitative human scale to later correlate with the aerial established methodology (vulnerability assessment maps). It builds on a previous case study of how one team of administrators exercised disaster resilience during Hurricane Harvey and aims to use AI and data analysis to identify vulnerabilities in infrastructure. Specifically, this study focuses on universities along the Gulf of Mexico. It uses built environment imagery from two scales. (i) aerial: satellite images, flooding, density, digital elevation models (DEM), and materials types maps. (ii) human and street view imagery.

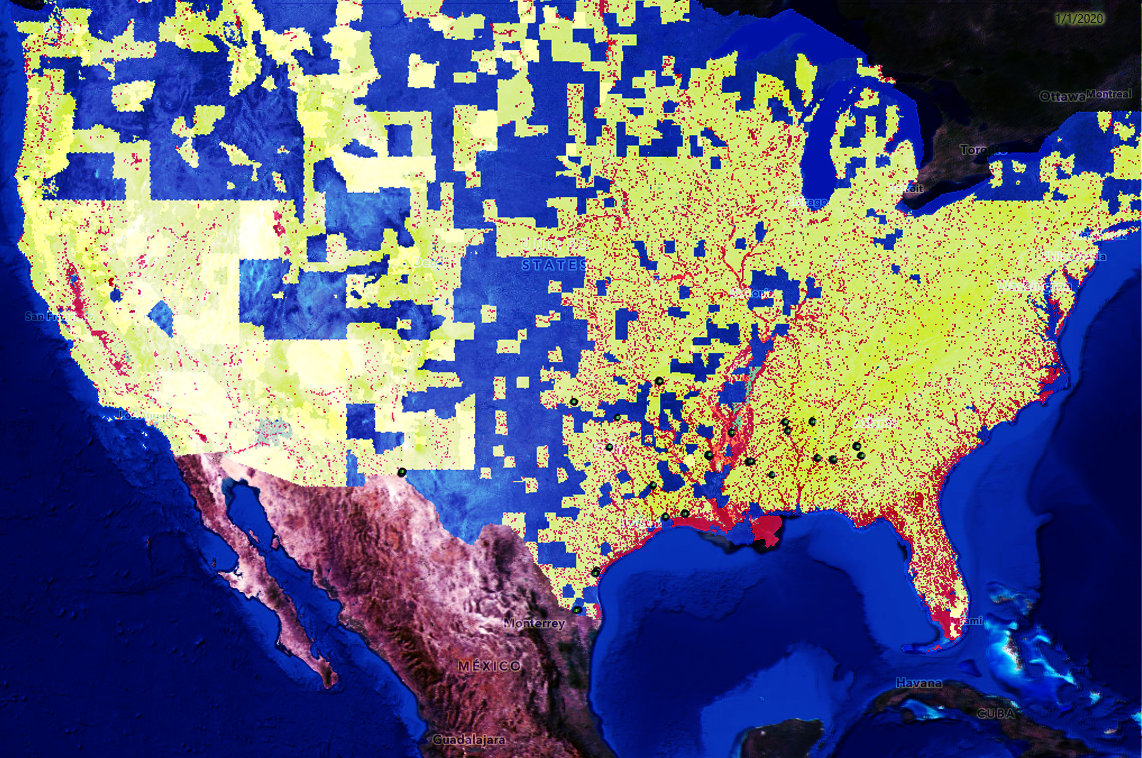
On red are public campuses in the USA, covering the states of Texas, Louisiana, Oklahoma, Alabama, Arkansas, Tennessee, Mississippi, New Mexico

We used the Open Street Map (OSM) API to extract the road network of each campus located within a 5km radius to gather data for our project. We created a grid of 12.5 meters to determine the geo-coordinates based on the roads' axial

We only selected campuses with 80% or more street view images of their facilities to ensure we had almost a complete set of images.
Data collection
Aerial
GIS Data
We collected 675,486 images from 30 universities, including 96,498 satellite images, 192,996 street view images, 96,498 flood maps, 96,498 density maps, 96,498 DEM maps, and 96,498 material-by-type maps. On average, each campus had 3721 geo-coordinates.
We use ArcGIS online to collect data on flood, density, and DEM maps. And google API to collect satellite images. The aerial imagery will be used for context understanding and vulnerability correlation


Human
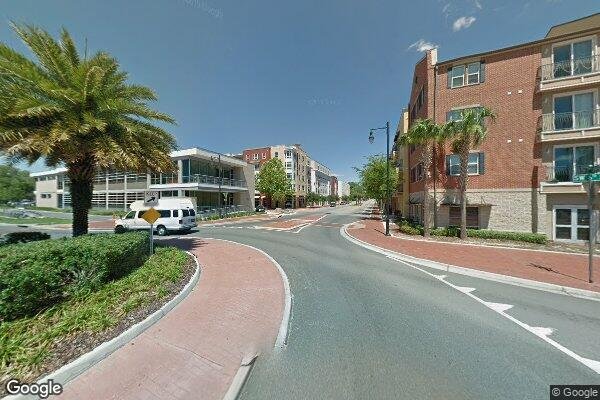
Street-view images
We used Google API to collect street-view. The street-view images will be used to train a supervised classifier AI algorithm to identify vulnerable infrastructure elements and calculate an aggregated quantile to define vulnerability at the human scale based on the elements identified in images.


Data Processing
Aerial
To capture qualitative feedback on flooding vulnerability at a human scale, we developed a web interface that integrates all collected data. The aerial view served as contextual information to assist in labeling of the street view images. To streamline the labeling process, we implemented a cluster-then-label approach to generate training data for the qualitative assessment of flooding vulnerability. This approach incorporates an AI feature extraction algorithm (T-SNE) and an unsupervised clustering algorithm, Self Organizing Map (SOM).
Flooding Vulnerability
We collect the NOA vulnerability map at the aerial level; this map identifies areas that will be characterized as having high, mid, and low flooding vulnerability.

Human
Artificial Intelligence
We employed an AI feature extraction algorithm (FE) trained with the VGG-16 database to extract meaningful feature vectors from the street view images for the cluster-then-label strategy. We then applied a dimensionality reduction algorithm, T-SNE, to reduce the dimension of each feature vector from 4096 to two dimensions. The reduced feature vectors were then fed into an AI unsupervised clustering algorithm called Self Organizing Maps (SOM) to identify the most relevant built environment types in different campuses.

Streetview images
To collected a sizable collection of label data we will use a cluster-then-label approach to create the training data. To create a vulnerability map at the human level, we will start by collecting human perception while looking at Streetview images and labeling them based on the objects identified in the images and how they bring the perception of risk when a flooding event occurs.

Training Data
We developed a web interface to assist in labeling the data using street-view images. The cluster-then-label process allowed us to assign labels to a reduced ground truth data set and extrapolate their labels to similar piers. This approach helped create a grid of the most representative building environments that can be used to label the vulnerability of campus facilities through built environment imagery.
