
AI AS ACTIVE AGENT FOR CREATIVE EXPLORATION IN DESIGN PEDAGOGY
An AI design methodology for conceptual design in an educational context
In collaboration with Lee-Su Huang.
Artificial Intelligence excels at solving problems with clear answers, processing data, and performing repetitive tasks, freeing up time for architects to work on more open questions that require creativity. With today’s abundance of Data and Artificial Intelligence (AI) algorithms, AEC practitioners can effectively encode, organize, and generate spectral and spatial information based on the data itself. However, it is still challenging to integrate such technologies in design workflows as an active tool for creativity and exploration.
This article takes a particular stance by considering an iterative collaboration between humans and machines within a design studio to test how AI algorithms and data analysis can fit within an architectural design exercise that investigates the relationship to placemaking in a natural landscape through a range of small-scale projects.
In this article, we will divert towards a different avenue that uses AI as an explorative tool for creativity and not an optimization tool for productivity. With such motivation, this article presents a fourfold methodology to implement AI and visualization tools in a design studio. The AI algorithms implemented in this work have been coded using built-in functions within the software Wolfram Mathematica (https://www.wolfram.com/mathematica/, accessed March 2022).The algorithms, software, and data sources used in the methodology are described in Table 1, which also displays which part of the methodology they have been used.

Description of Types of Algorithms and Software used in each method within the methodology
1. Identification of User Needs and Context (images and text data from social media)
By the end of 2022, it is estimated that there will be 3.96 billion social network users worldwide (Yu et al. 2020).One of the most significant opportunities offered by such data is the potential to understand, follow or analyze a specific topic from a third-person view, where the topic is not rooted in a specific place or time but can be viewed from various geographic locations and in different time ranges (Pandey & Purohit, 2018). Hence, the main objective of this module was to capture a concept through time and space from a third-person view or, even more accurately, a collective societal viewpoint.
Students’ first task was to create a combination of keywords close to their initial design intent and user needs by linking a list of concepts that resonated with their design intentions for their projects and a list of concepts based on the users’ needs. These keywords were used to collect social media posts via an automated Twitter crawler without a geolocation constraint, collecting over 5000 social media posts per student from 2010 to 2021. Then, students initiated a process of automatically encoding the image data from the posts using AI feature extraction algorithms in four ways: RGB analysis, Edge Detection, Fourier transform, and automatic object detection. After having the data numerically encoded, they input it into an unsupervised clustering algorithm called a Self-Organizing Map (SOM) to represent the data in a reduced 2-dimensional space. As the posts are multimodal, they can be visualized using either their image
Description of Types of Algorithms and Software used in each method within the methodology
or text representation.
A compilation of SOM grids (output from an unsupervised clustering algorithm) organized by the text data from the collected social media posts
Consequently, they can select a group of cells (that by themselves are groups of similar data points) to continue with the exploration that aims at creating an atmospheric understanding of such initial concepts for the design intervention.
A compilation of SOM grids (output from an unsupervised clustering algorithm) organized by the image data from the collected social media post, overlaid with the selection by each student of images that resonated with their initial concepts
After selecting a group of images, the students started a collage process to create an atmospheric image.
Atmospheric images, a collage of selected images organized by SOM, these images capture the design intentions that students wanted to materialize in their designs
These images attempt to capture their intention through concepts they want to engage in their designs. Through this exploration, the students had a different understanding of the site that included a collective viewpoint characterized by the users and their activities. This approach goes beyond the typical site analysis that relies on limited site visits and mappings related to the site’s physical infrastructure and targeted interviews.
2. Storytelling and Branding (text data from digital books)
A common approach to writing a design brief is to find inspiration from books or articles dealing with theoretical or philosophical quests to describe concepts that are considered essential for the experience of the proposed design solution. With AI, we can expand our sight and access various libraries that offer multiple lines of thought. In this module, the students used ALICE (https://ask.alice-ch3n81.net), an AI power search engine that relates authors by the similarity of their text, and displayed paragraphs that included specific keywords to describe a concept.
3. Curating and Modeling Space (from point cloud data from terrestrial laser scanning)
In order to overcome the limitation due to the significant consumption of time and resources for high fidelity visualizations, we propose to work with point cloud models. We used two methods- a)gathering point cloud data of specific places and b)using terrestrial LIDAR laser scanning to capture the overall site- to collect a point cloud model of the site. By working with a point cloud model, students can index the site differently; they could explore areas on the site that were physically inaccessible and work directly on a precise representation of the site. This precise model showed below was transformed into a mesh in Rhino and used to CNC fabricate a physical site model.
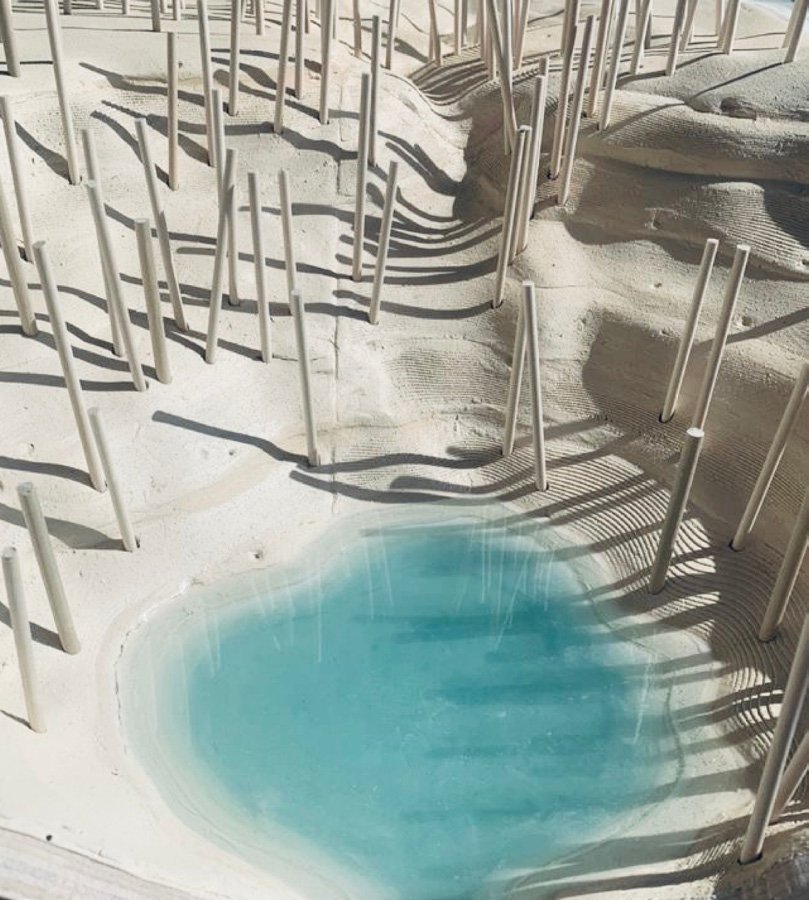
Images of the physical model of the site, on the left we can observe the layers defined by the CNC machine on the right is the final result by smoothing the surface, the trees are located exactly where the existing trees are in the site
4. Materialization of the Project (through 3D printing and game engines)
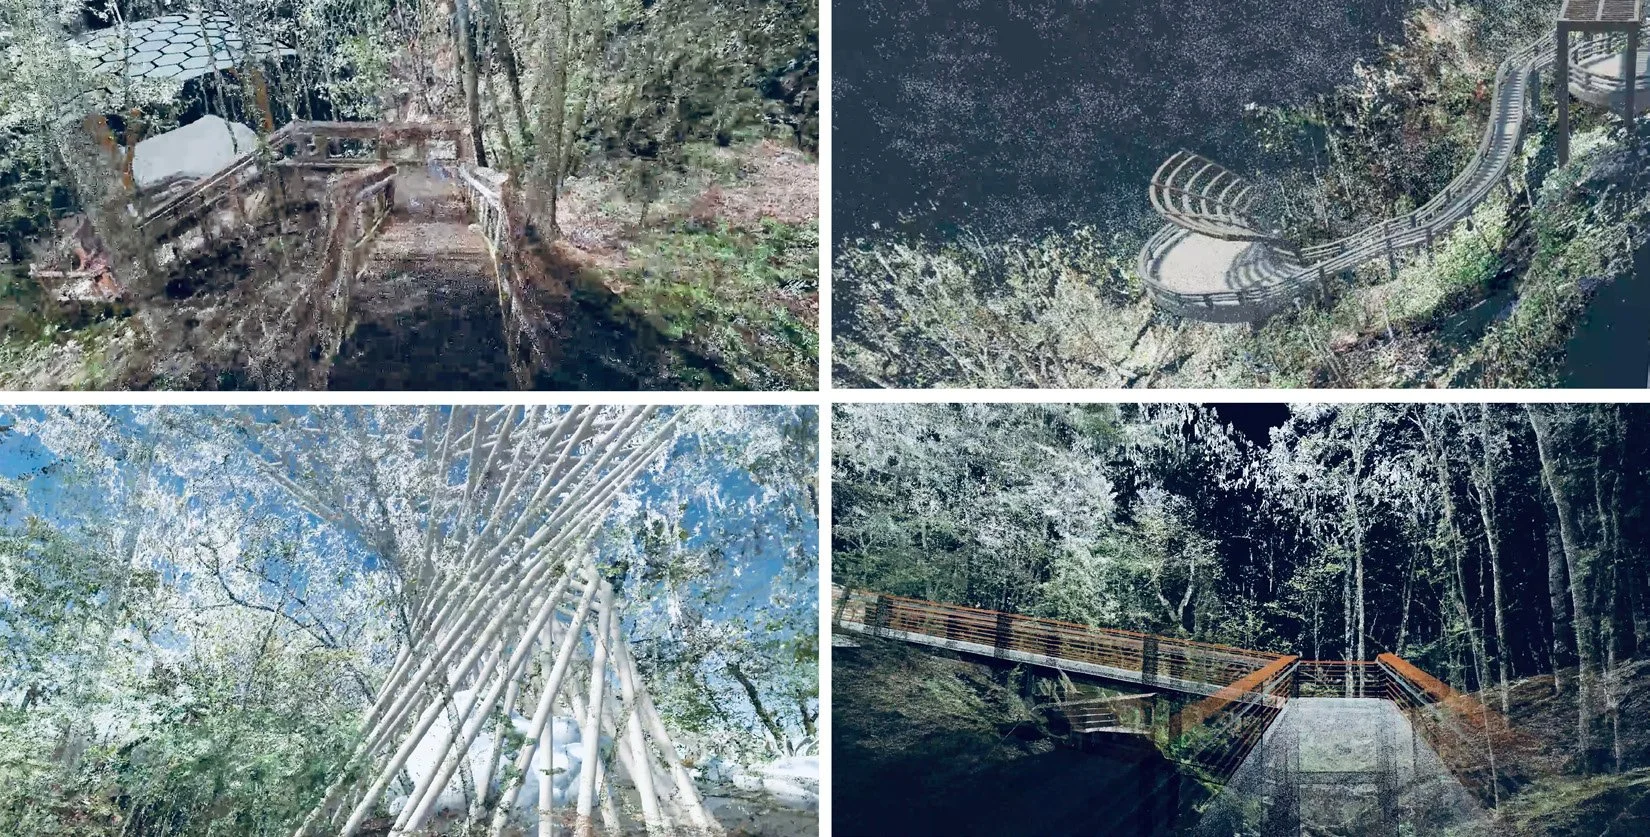
In this module, after segmenting their point cloud model in Cloud Compare, students moved to Rhino to concretize their design intentions, keeping in mind both the atmospheric images and the design brief as sources of inspiration for their projects. They then imported their design solutions into Cloud Compare to transform the 3D models (traditional polygonal surface modeling) into point cloud models while retaining the materials assigned from Rhino. After this process, the students imported the point cloud models into Unity. Once in Unity, they used Point Cloud Viewer and Tools to visualize the point cloud models.
A Sample of work from the students point cloud models visualized in Unity
Through this methodology, we showcased a series of modules that explored methods for implementing AI into an architectural education plan. The results of this research showed that the inclusion of AI and big data analysis can augment various creative abilities allowing designers to focus on questions that require human creativity rather than machine productivity. With the proposed validation process, we were able to identify which design abilities were augmented in each of the steps in the proposed design workflow.
a) Identification of User Needs and Context vs. Site Analysis
b) Storytelling and Branding vs. Design Brief
c) Curating and Modeling Space vs. Design Response
d) Materialization of the Project vs. Design Representation
If we understand the expansive definition of site analysis (Module 1 atmospheric image) to encompass society and culture, and program as a reflection of such concerns (Module 2 writing the design brief), the tools employed in the research begin to construct a way of symbolically synthesizing both data and the designer’s intent, as a powerful methodology for design exploration. The SOM used in Module 1 served to capture “the concerns of society as a whole” across a specific geospatial territory as well as over time, and provide a broader holistic view of public sentiment. The point cloud model (Module 3), due its dual nature of accuracy and abstraction, served as a living site the students could refer, analyze, and in cases edit or recompose to work with a design narrative, and ultimately leverage to materialize their projects in both physical and virtually experiential formats (Module 4).
Acknowledging that there is still much work to do in order to ensure ethical and biasfree interpretation of data, it is important that students take responsibility for the data we use, recognizing that AI is not solely to optimize processes but can be used to power creativity.
The design framework presented in this article joins already well-explored tools in design practices (point clouds, 3D printing, and game engines) with newly-explored tools (AI algorithms) that resulted in design solutions articulated through such a joint effort with artificial and human intelligence. Also, this new generation of AI tools are well-equipped to help uncover the elusive and augment the perception of human designers.
Gallery